
图文攻略 · 同一支视频的 13 张截图
Claude Code + Chrome DevTools MCP:让 AI 真正看见浏览器
Chrome DevTools MCP 服务器把一整个真实浏览器交给编码 agent——console 日志、DOM、网络请求、性能数据都能实时读取,不必再靠你手动粘贴报错。本文跟着 README 的安装命令走一遍,看清它暴露的 26 个工具,再用它完成一次调试:找出一个坏掉的图片和一个没启动的 API。
约 5 分钟 · 13 步,每步都能跳到原视频的精确秒数
一句话说清 Chrome DevTools MCP 改变了什么
没有它,agent 调试网页基本是瞎的:你说症状、你贴报错。Chrome DevTools MCP 服务器把实时浏览器包装成工具,补上的就是这个缺口。Claude Code 一行就能装完——claude mcp add chrome-devtools npx chrome-devtools-mcp@latest——依赖只有 Node.js v20.19 或更新的 LTS、Chrome 稳定版和 npm,启动后显示 26 个工具。视频随后按它该有的用法演示:一句要求定位根因的 prompt、点一次工具授权,agent 就自己打开页面、读 console、抓出六条网络请求,并点名两处失败各自对应的 net:: 错误。你可以逐行在 Chrome 自己的 Console 和 Network 面板里核对——因为那就是同一份证据。
来源视频
所有截图都来自 StonerStack 的录屏:一支先安装 Chrome DevTools MCP 服务器、再用它调试本地页面的完整演示。
截图仅用于给本站原创的步骤说明配图。演示是在 VS Code 里用 GitHub Copilot 的 agent 模式(Claude Sonnet 3.5)完成的,并非在 Claude Code 里;画面中的 Claude Code 命令来自服务器 README。工具要出现必须先重启 VS Code,视频中没有出现任何价格、套餐或 token 数字。
它解锁了什么
一个连接件,让 agent 自己读实时浏览器,而不是等你把报错复制过去。
- 1
从 Google 自己的说明开始
developers.chrome.com 那篇博客是最快的入门:它讲清这个服务器是什么、为什么重要、能读什么。旁边的 Performance 面板就是它的价值——Largest Contentful Paint 0.98 s 属于良好,而 Cumulative Layout Shift 0.29 属于较差,这正是 agent 现在能自己读出来的数据。博客给的性能 prompt 是 'Localhost:8080 is loading slowly. Make it load faster.'
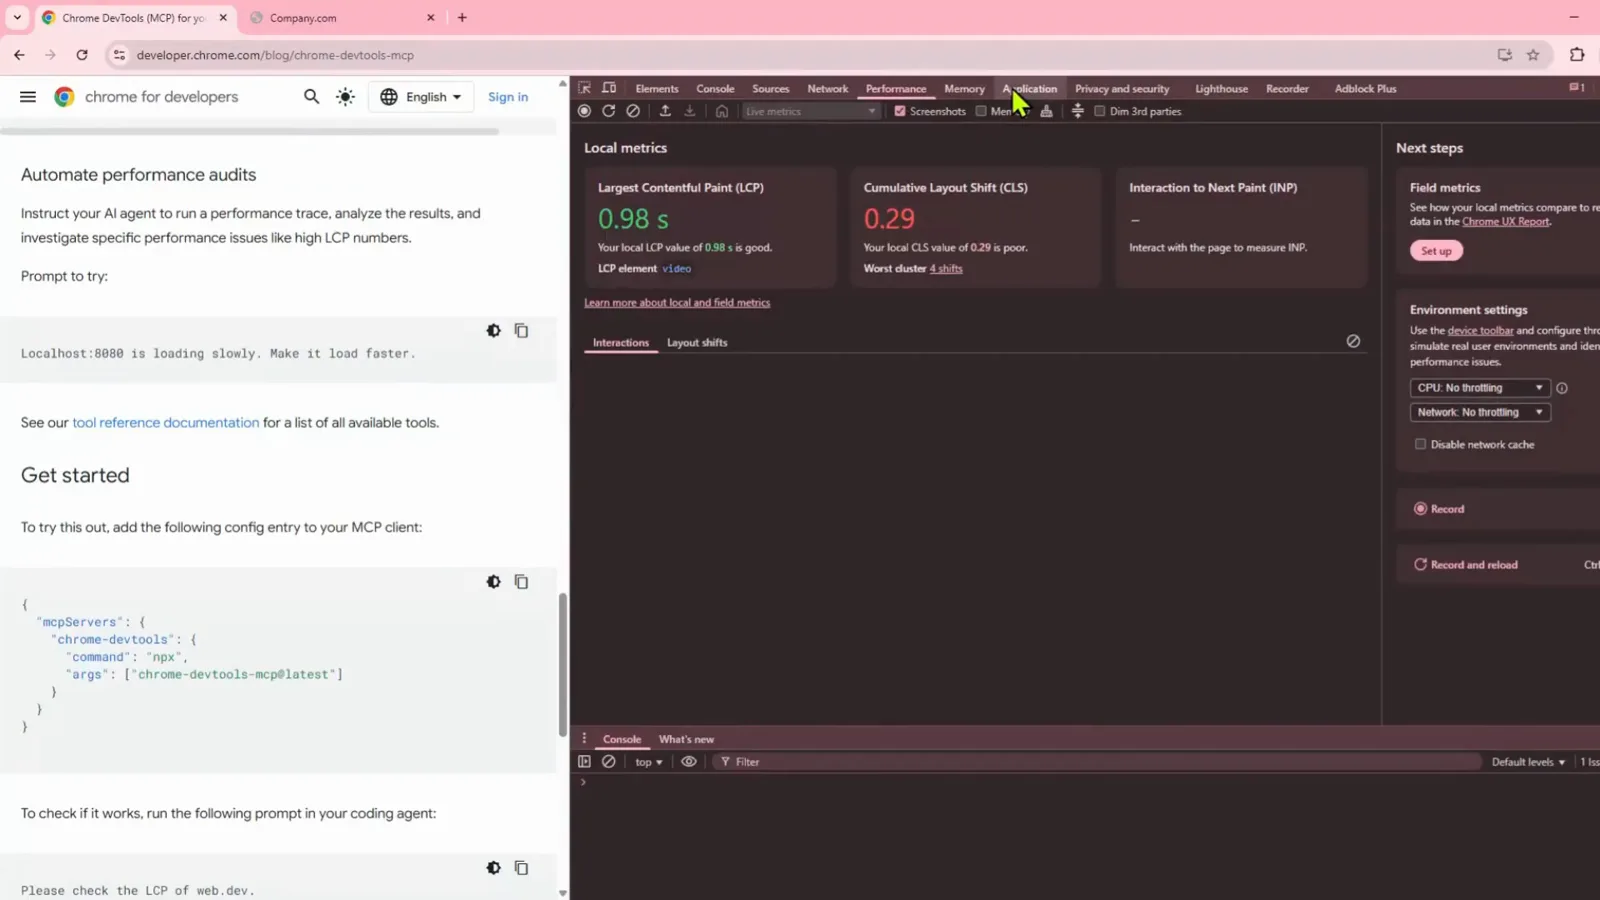
Google 的博客讲原理,Performance 面板展示它能把什么样的数字交回来。跳转到 1:20 - 2
复制配置,跑一次冒烟测试
同一篇文章还给出了可以直接粘贴进客户端配置文件的 mcpServers 配置块,以及一行冒烟测试——'Please check the LCP of web.dev.'。这是个很好的第一项检查:如果 agent 能测出真实页面的 LCP,说明浏览器连接已经通了。
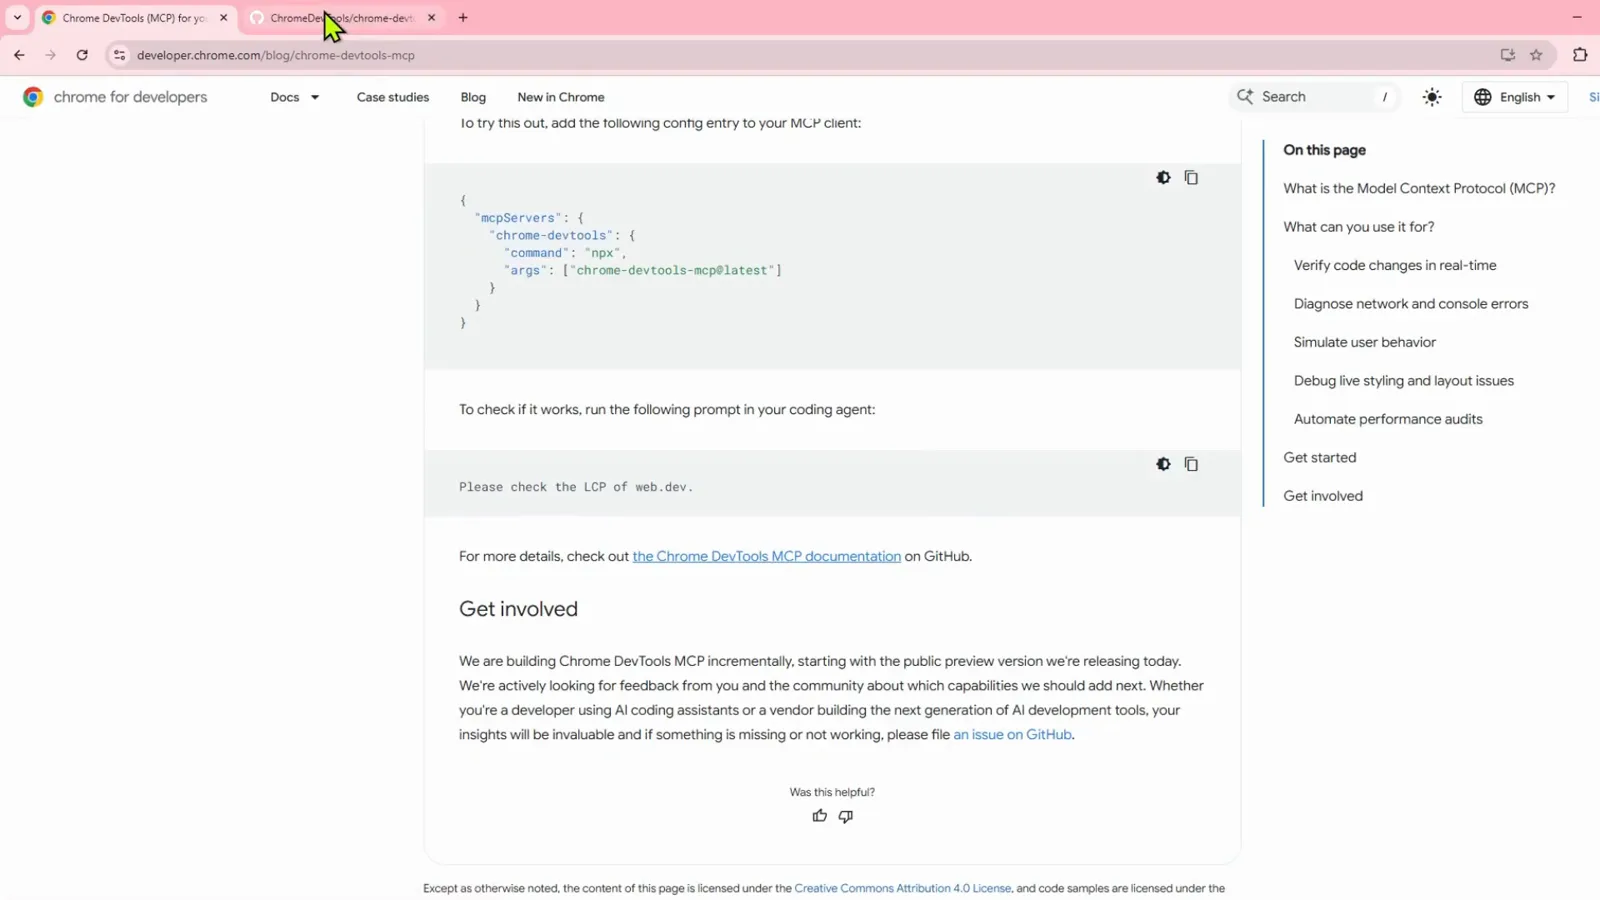
一块配置粘贴进去,一句 prompt 就能验证连接是否打通。跳转到 2:05 - 3
确认三项依赖
README 的 Requirements 一节很短:Node.js v20.19 或更新的 latest maintenance LTS 版本、当前稳定版 Chrome、以及 npm。不需要再装别的东西——MCP 客户端启动时会通过 npx 把服务器拉起来。
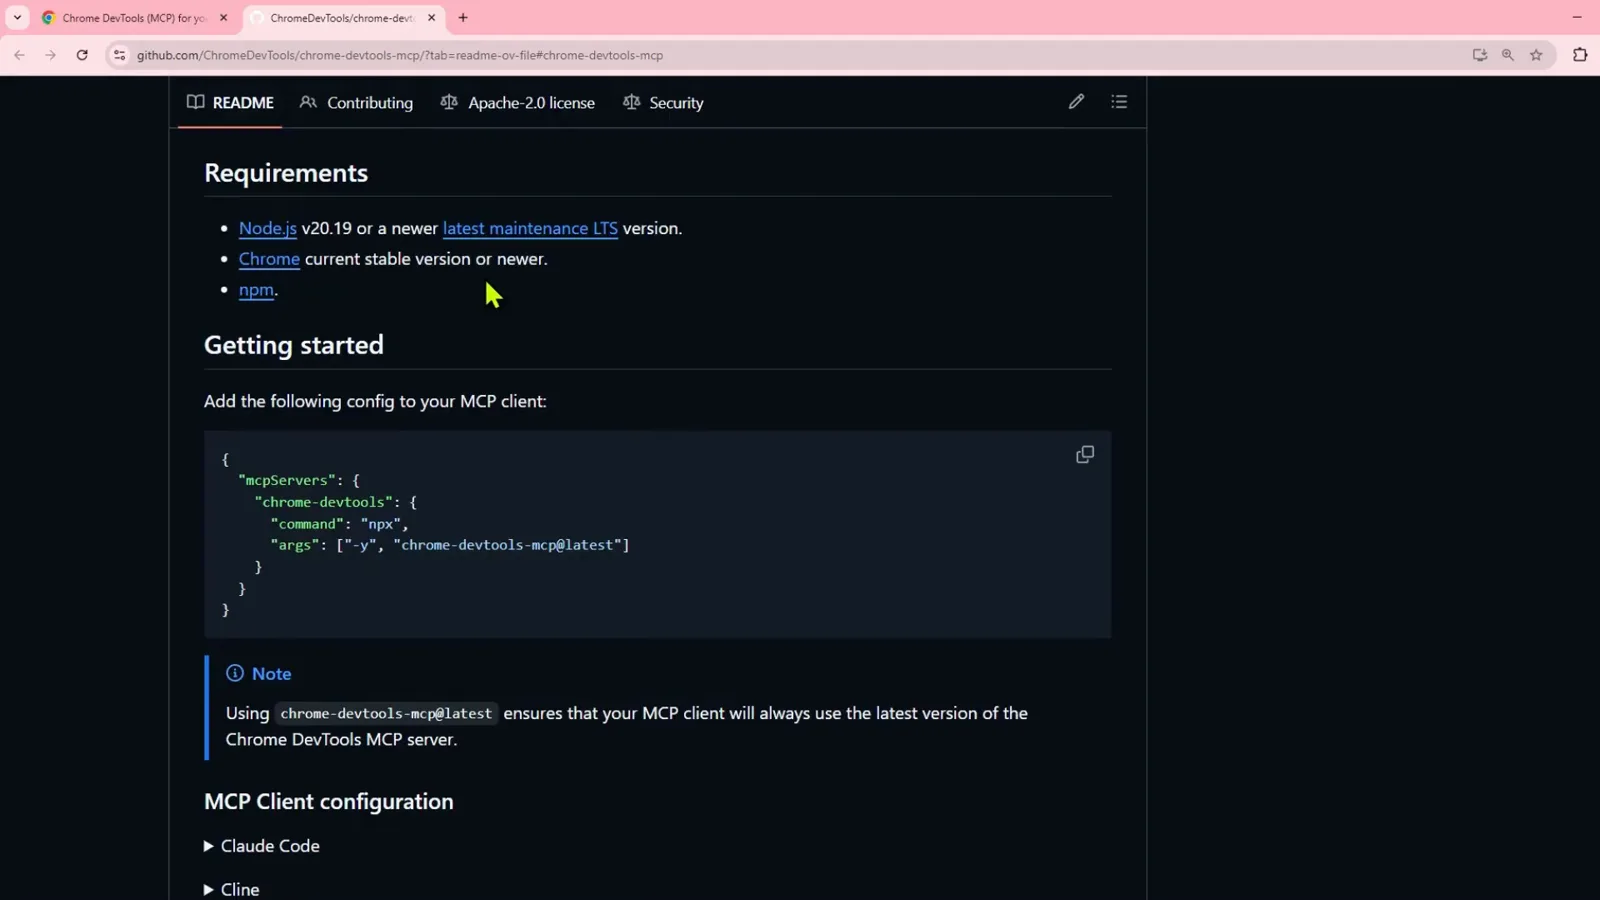
Node、Chrome、npm。服务器走 npx 运行,所以没有单独的安装步骤。跳转到 2:20
给 Claude Code 装上
README 里一条命令,或者走编辑器自己的添加方式——然后确认那条启动工具的条目。
- 4
Claude Code 的安装命令
README 的 MCP Client configuration 一节里有 Claude Code 条目,命令写得很明确:claude mcp add chrome-devtools npx chrome-devtools-mcp@latest。执行一次,服务器就注册在对应范围内——不用手改 JSON。
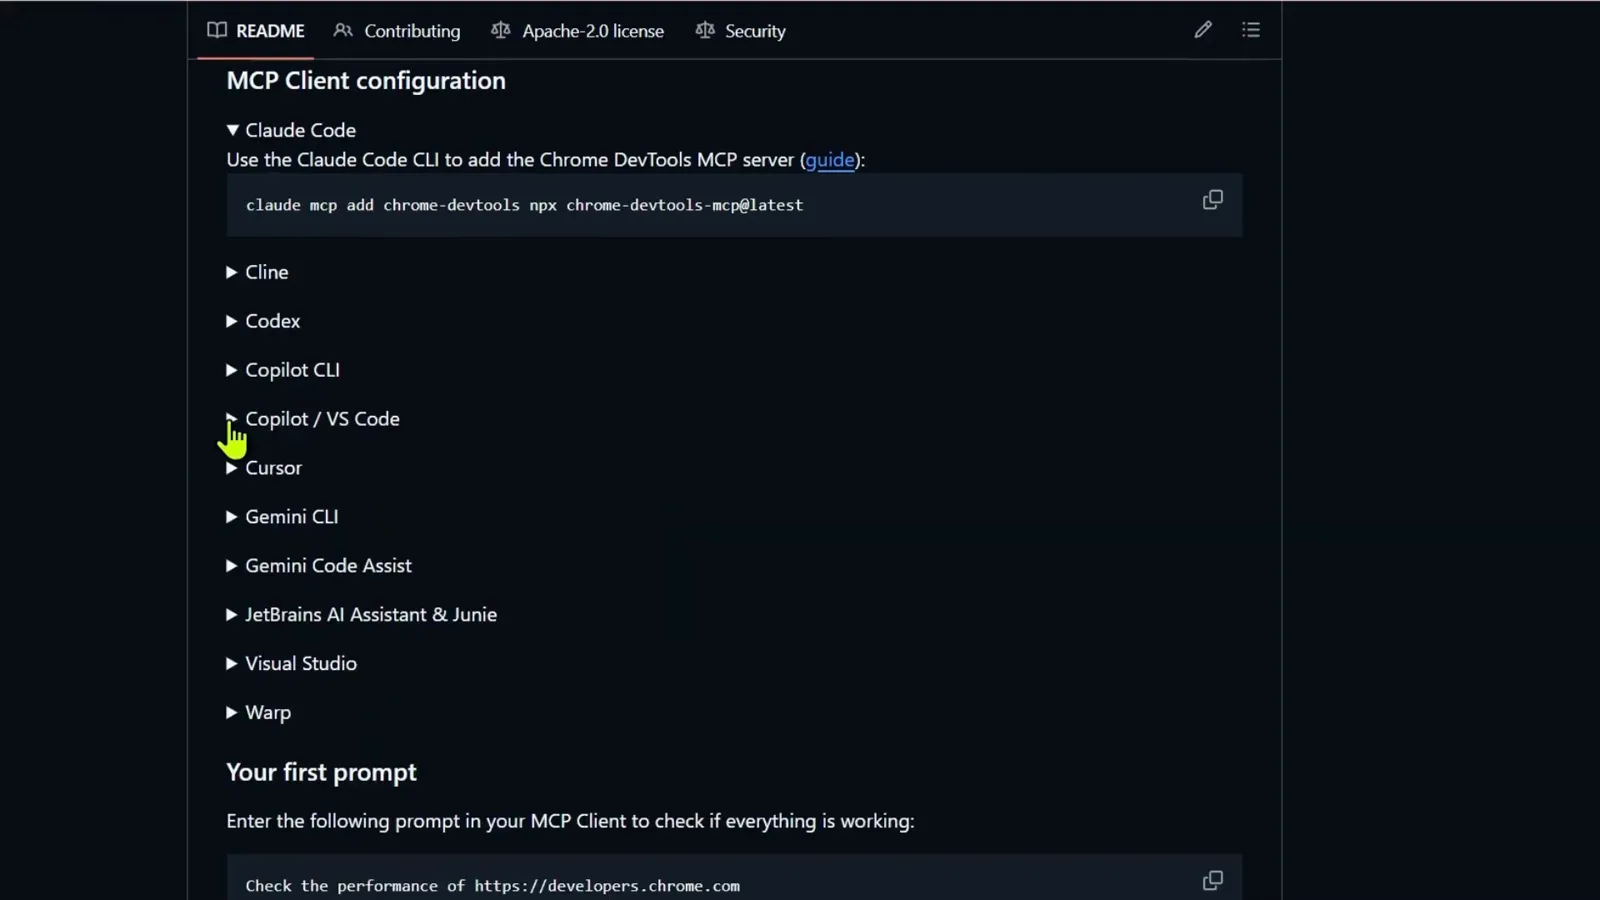
README 的 Claude Code 部分,以及那条可以直接复制的 mcp add 命令。跳转到 2:45 - 5
或者从编辑器这一侧加
如果你在 VS Code 里工作而不是用 Claude Code CLI,VS Code 的 MCP 文档列出了多种注册方式;视频只推荐其中两种:命令行和用户配置文件。命令行那条就是 code --add-mcp 示例,而它对引号非常挑剔。
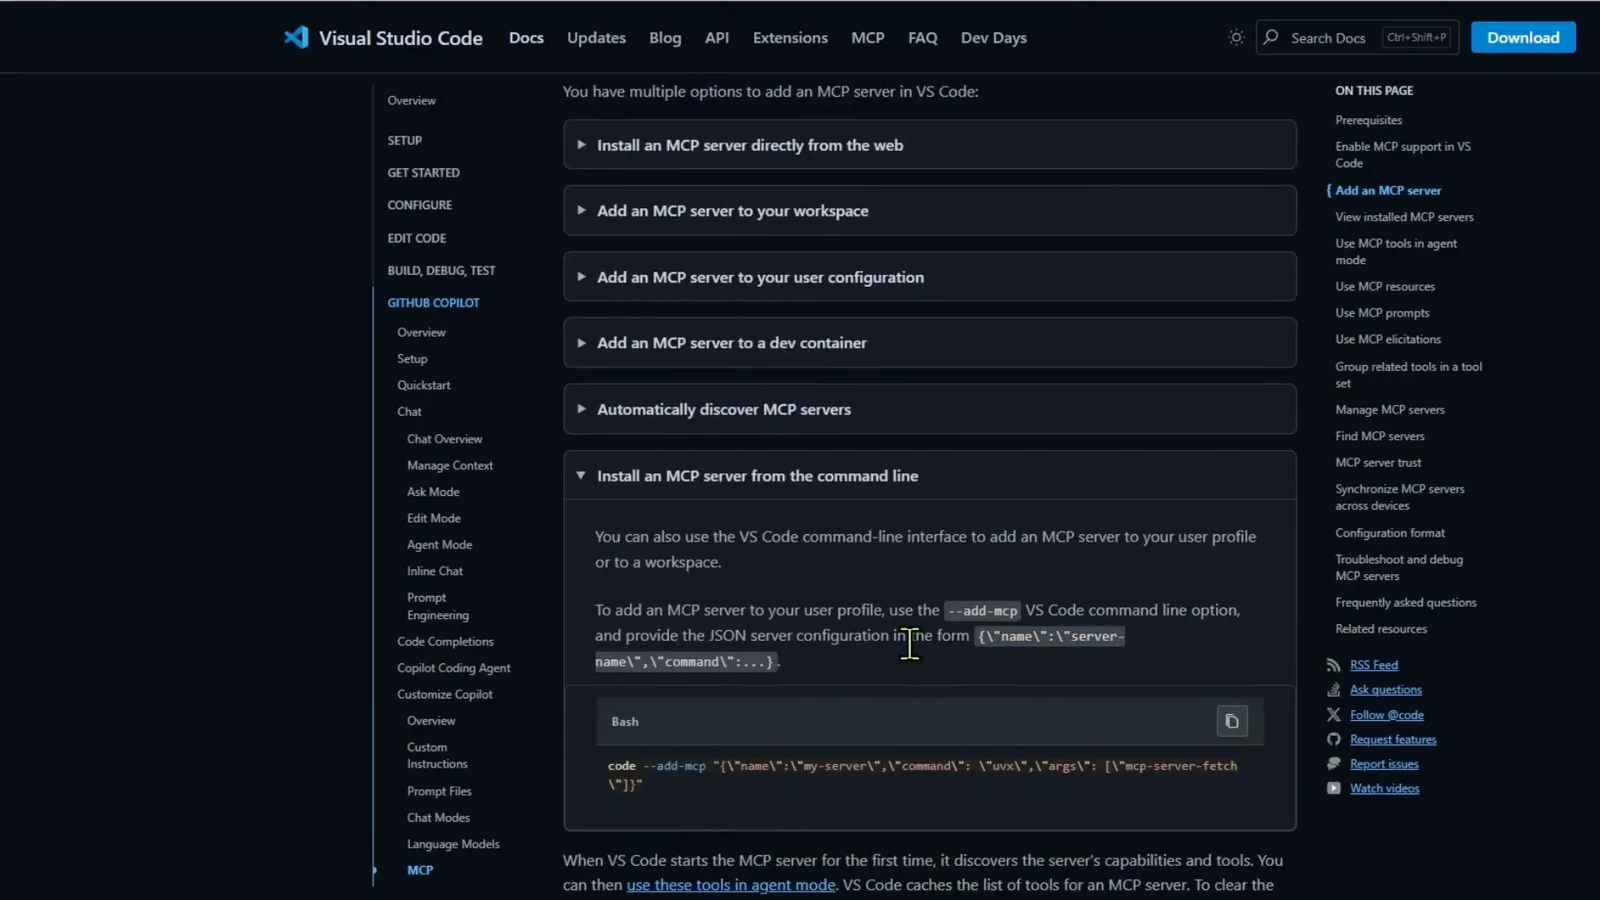
VS Code 文档给了多种安装路径,视频只推荐命令行和用户配置文件这两种。跳转到 3:30 - 6
那条启动 26 个工具的条目
第一次尝试失败了——JSON 里的双引号必须转义——成功后终端显示 'Added MCP servers: chrome-devtools',用户级 mcp.json 里多出一条 chrome-devtools 条目,用 npx 运行 chrome-devtools-mcp@latest。启动后它被标注为 'Start | 26 tools'。
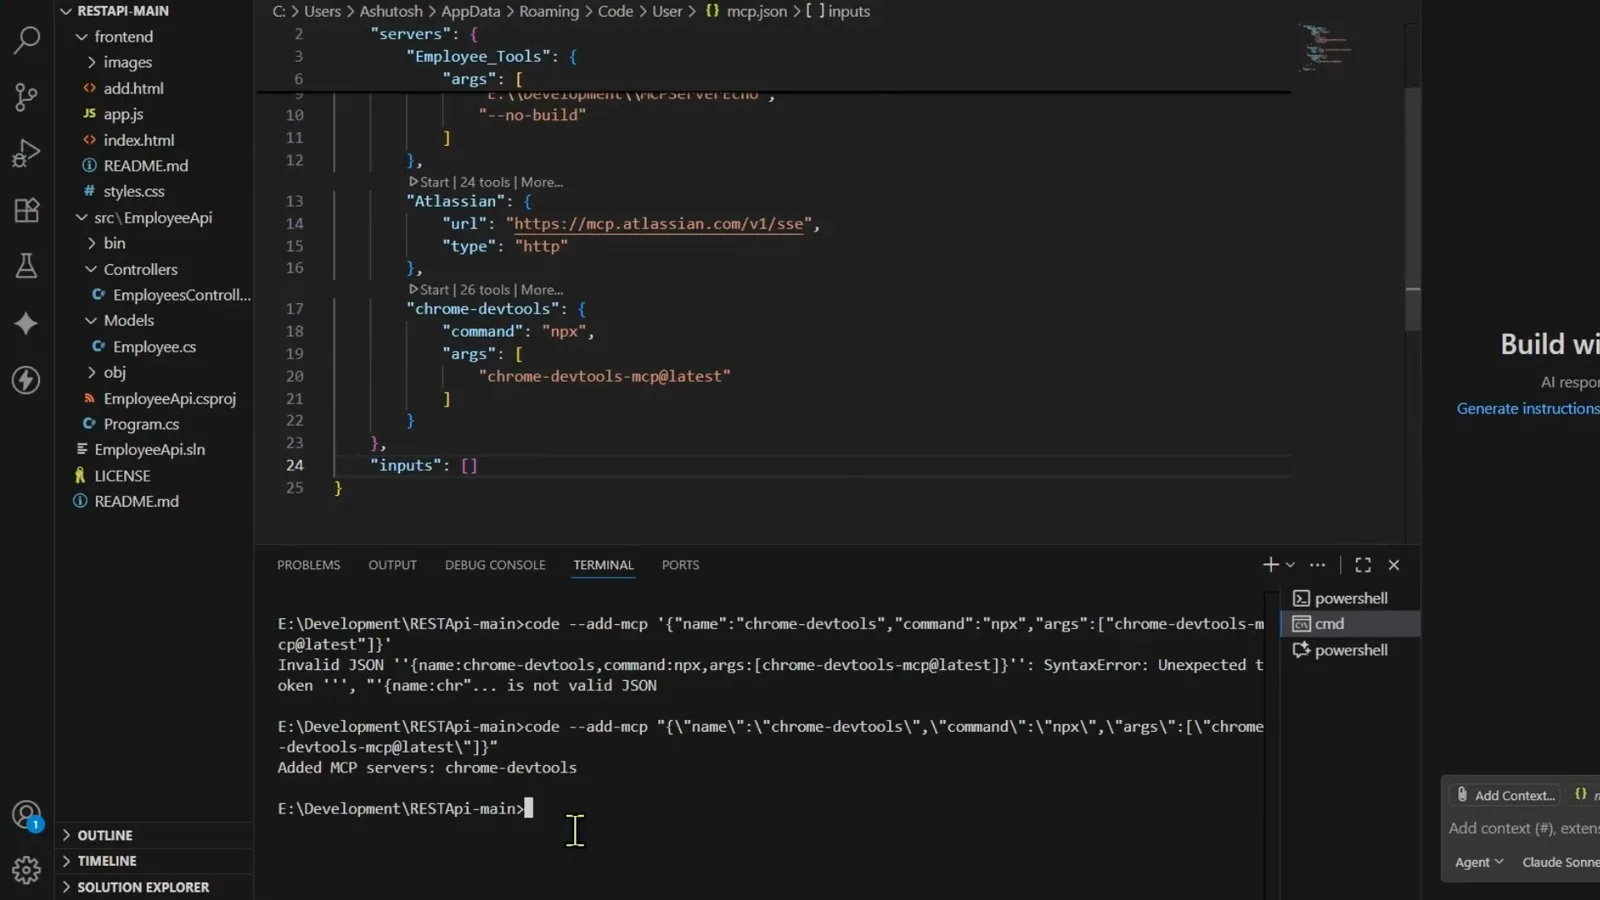
添加成功的提示、它写进去的 JSON,以及服务器报告的 26 个工具。跳转到 4:15
工具面
那 26 个工具到底覆盖什么,按 agent 自己分组的方式看。
- 7
导航与页面管理
重启 VS Code 之后,agent 会按用途列出工具。Navigation and Page Management 包含 navigate_page、navigate_page_history、new_page、list_pages、select_page、close_page、resize_page;Page Interaction 包含 click、fill、fill_form、hover、drag、upload_file、handle_dialog、wait_for。这一半才是让 agent 真正操作一个标签页的能力。
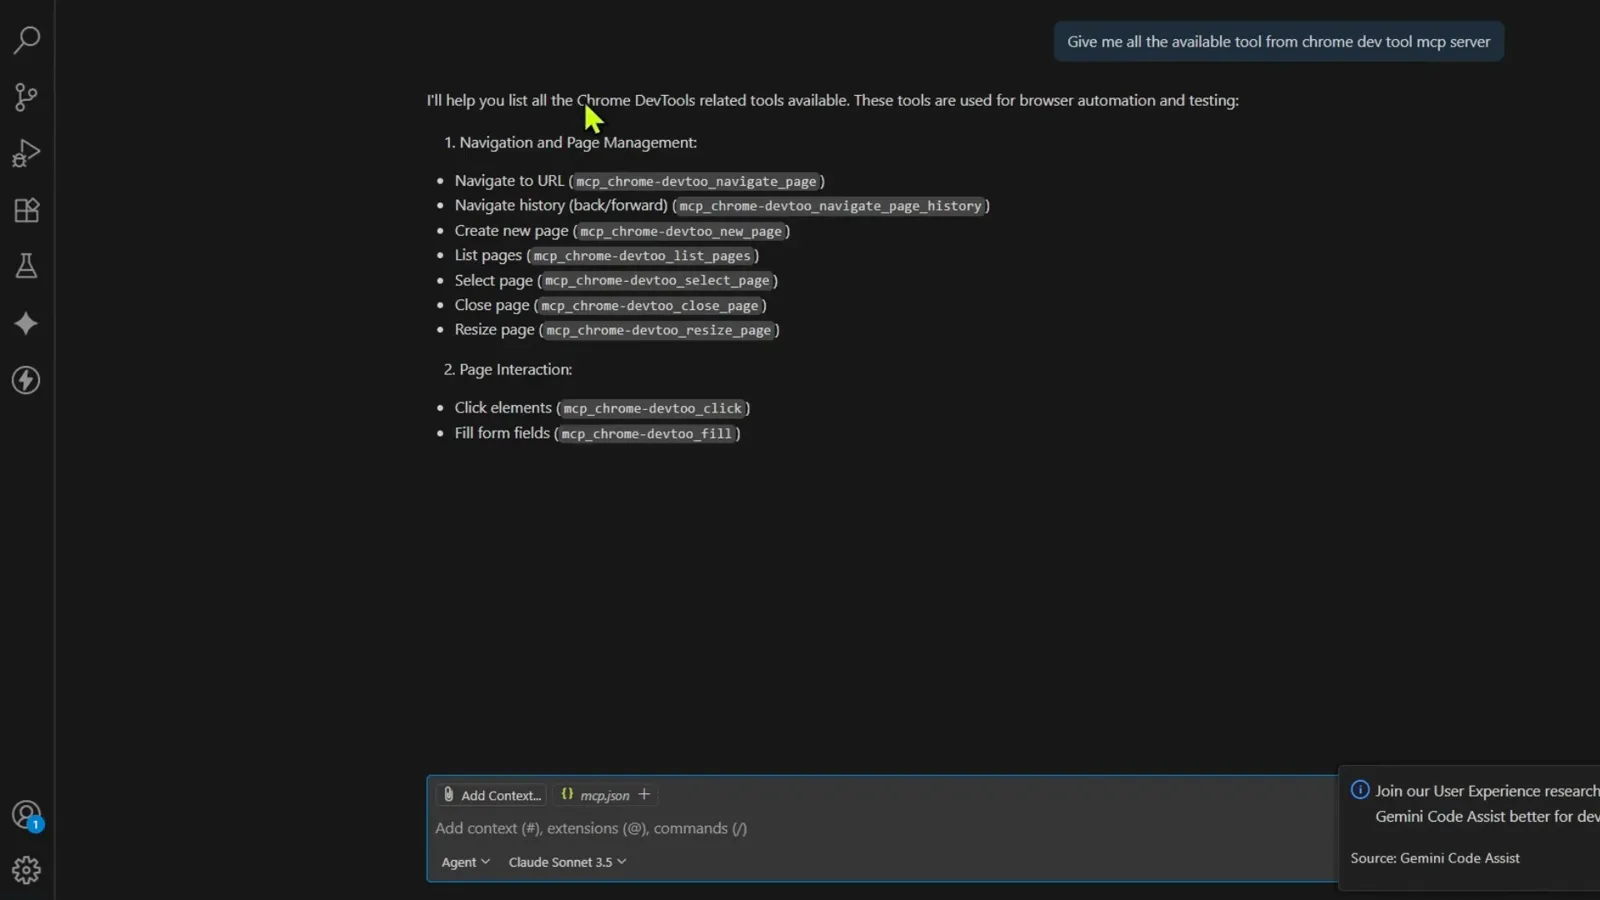
agent 按用途给工具分组,而不是把 26 行平铺出来。跳转到 5:20 - 8
分析、console 与网络
清单的另一半是诊断用的:Page Analysis 包含 take_snapshot、take_screenshot、evaluate_script、list_console_messages、list_network_requests。最后两个正是把「这是我的报错」变成「这是 agent 自己取回的证据」的关键。
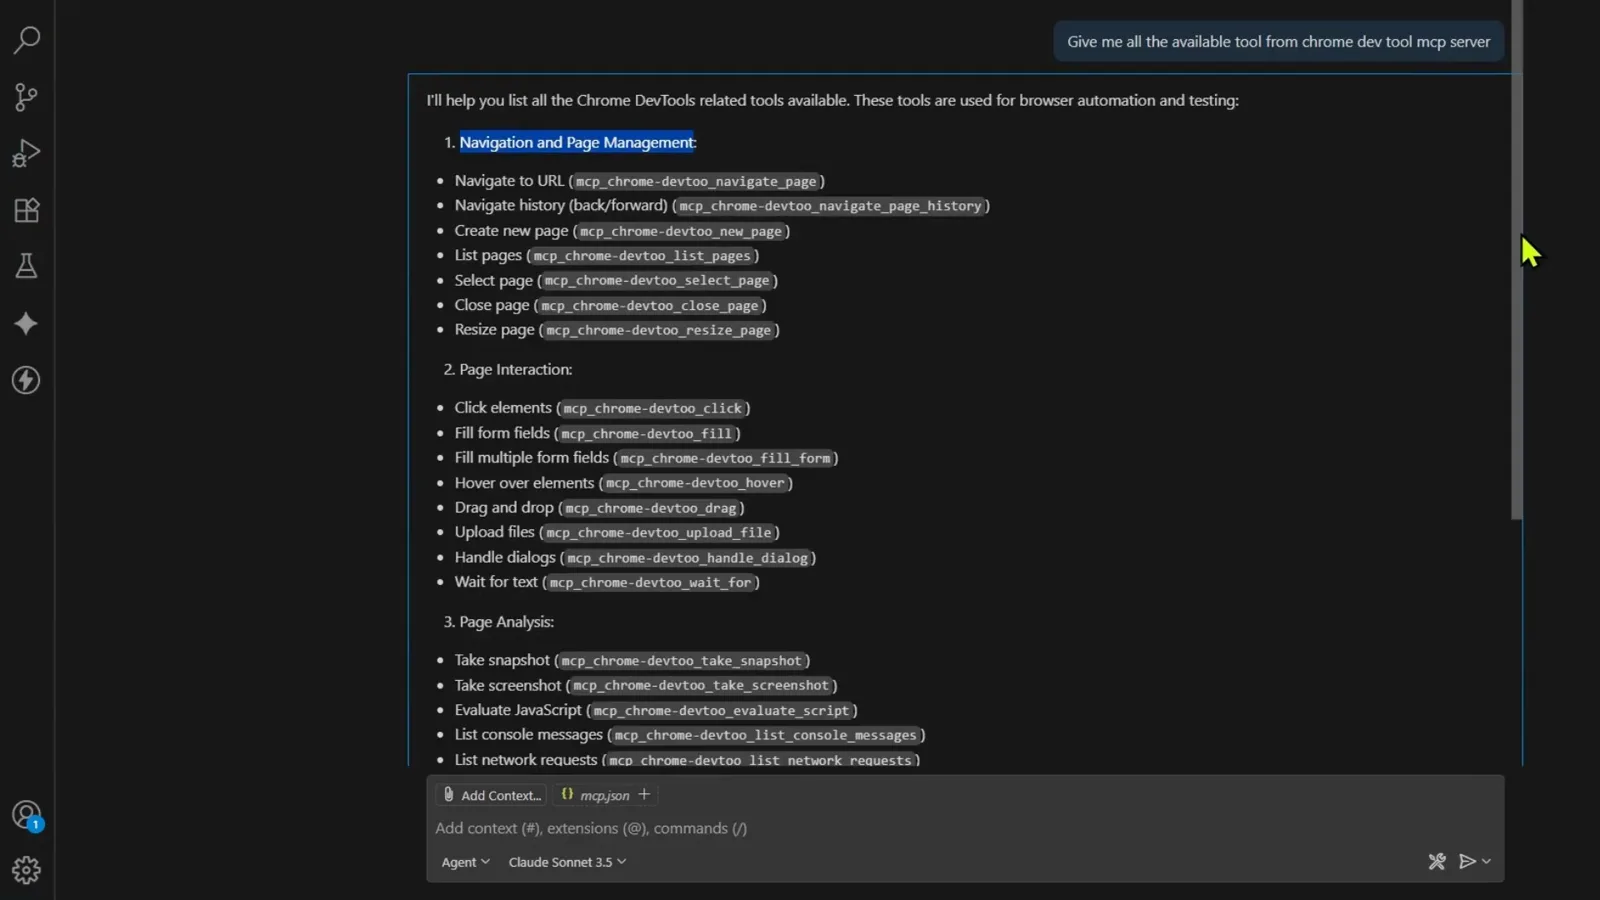
诊断类工具:快照、截图、执行脚本、console 消息与网络请求。跳转到 5:40
用它调试一个坏页面
一个内容缺失的本地页面,在零手动粘贴的情况下被定位到两处具体失败。
- 9
从一个肉眼可见坏掉的页面开始
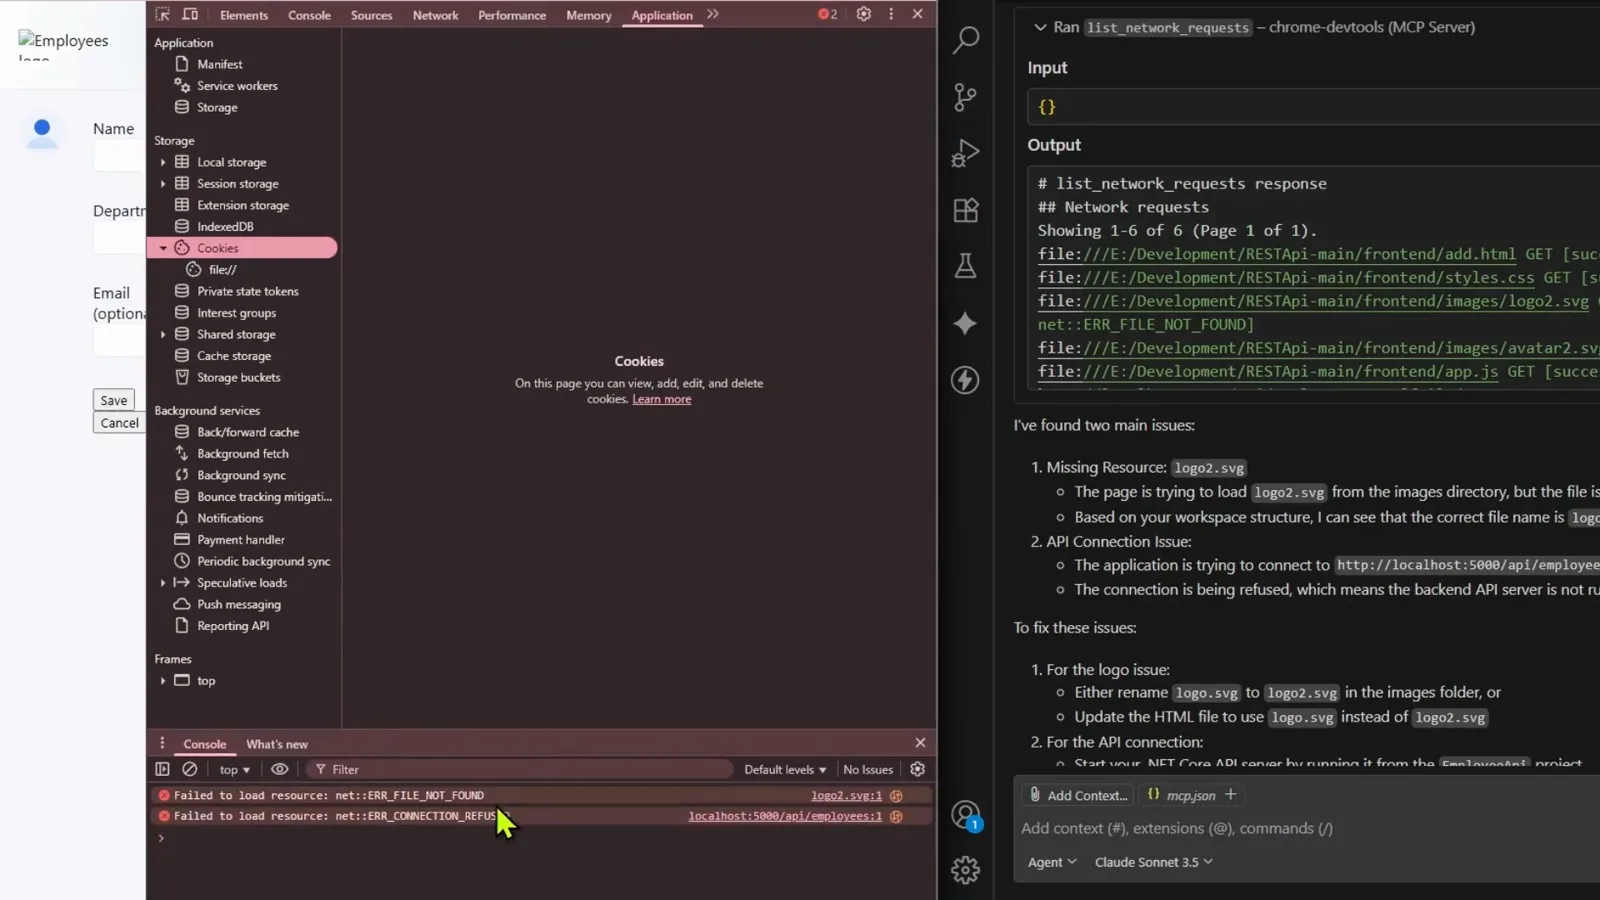
演示对象是本地的 Add Employee 页面。左侧导航栏出现图片加载失败的图标,Name、Department、Email 三个字段全是空的——肉眼就能看出不对,而这正是过去只能把 console 输出复制进聊天框的场景。
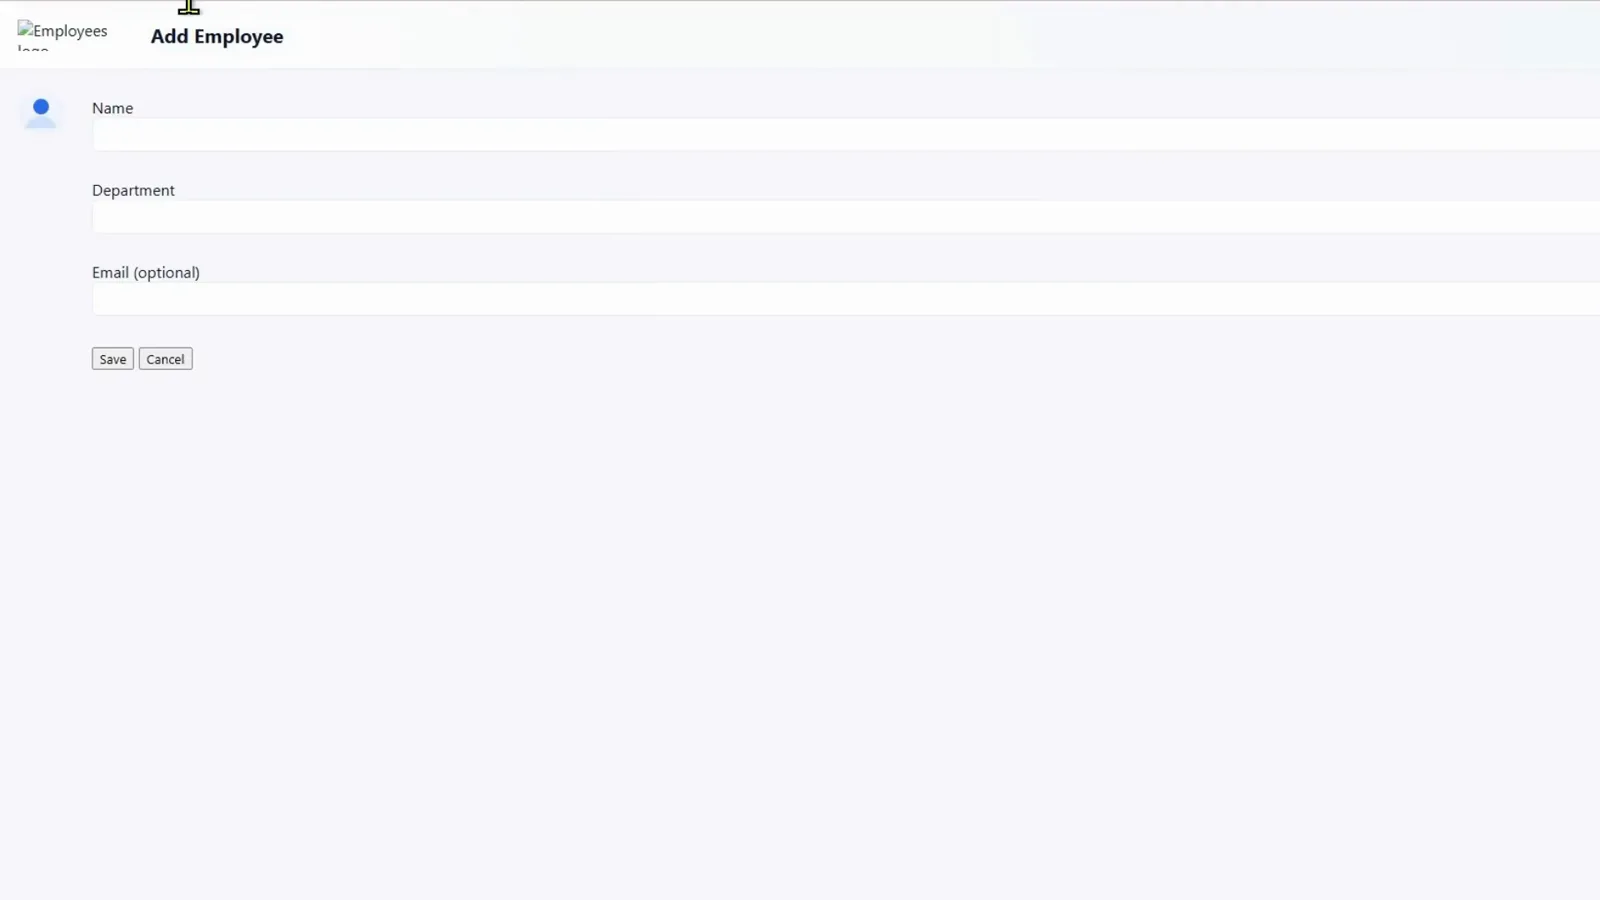
一个明显坏掉的页面:一张没加载出来的图片,和一个全是空字段的表单。跳转到 6:10 - 10
问根因,并授权工具
prompt 给得很克制——只有文件路径加上一句「要根因」——agent 立刻申请执行 new_page 工具,目标是 file:///E:/Development/RESTApi-main/frontend/add.html。授权之后它打开了一个真实 Chrome、自己导航过去,接着连续调用 list_console_messages 和 list_network_requests。
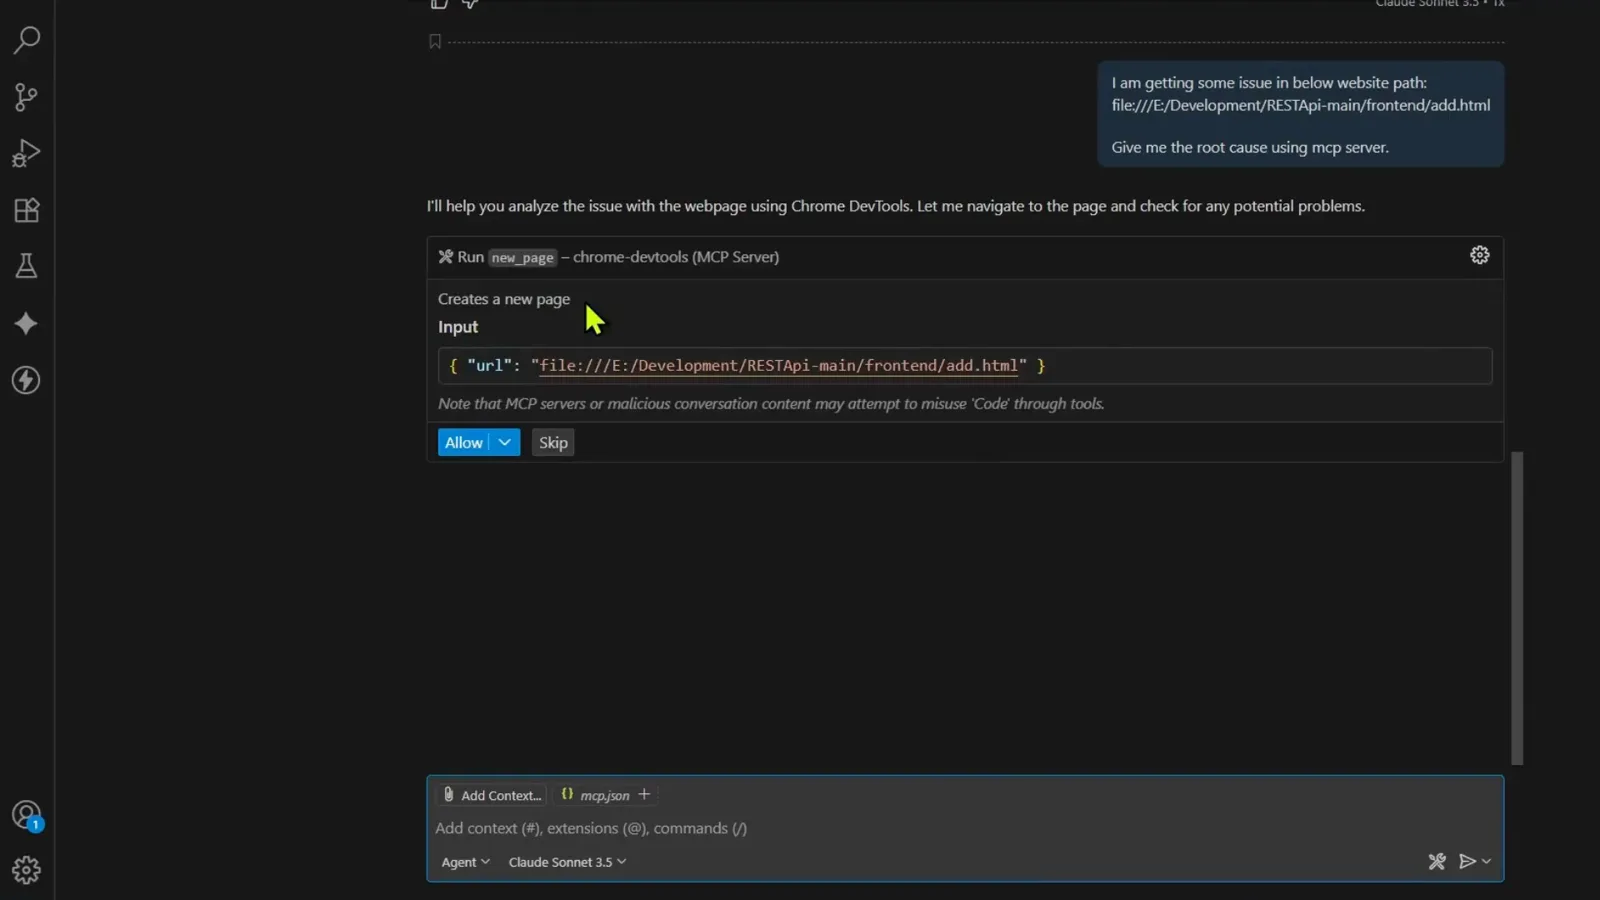
一张授权卡片之后,agent 自己打开页面并开始收集证据。跳转到 6:40 - 11
六条请求,两处点名的失败
list_network_requests 针对该页面返回六条请求,agent 报出两个主要问题:images/logo2.svg 失败于 net::ERR_FILE_NOT_FOUND,http://localhost:5000/api/employees 失败于 net::ERR_CONNECTION_REFUSED。它给的修复也很具体——把 logo.svg 改名为 logo2.svg,或者把 HTML 指向 logo.svg;以及启动 .NET 的 EmployeeApi 项目。
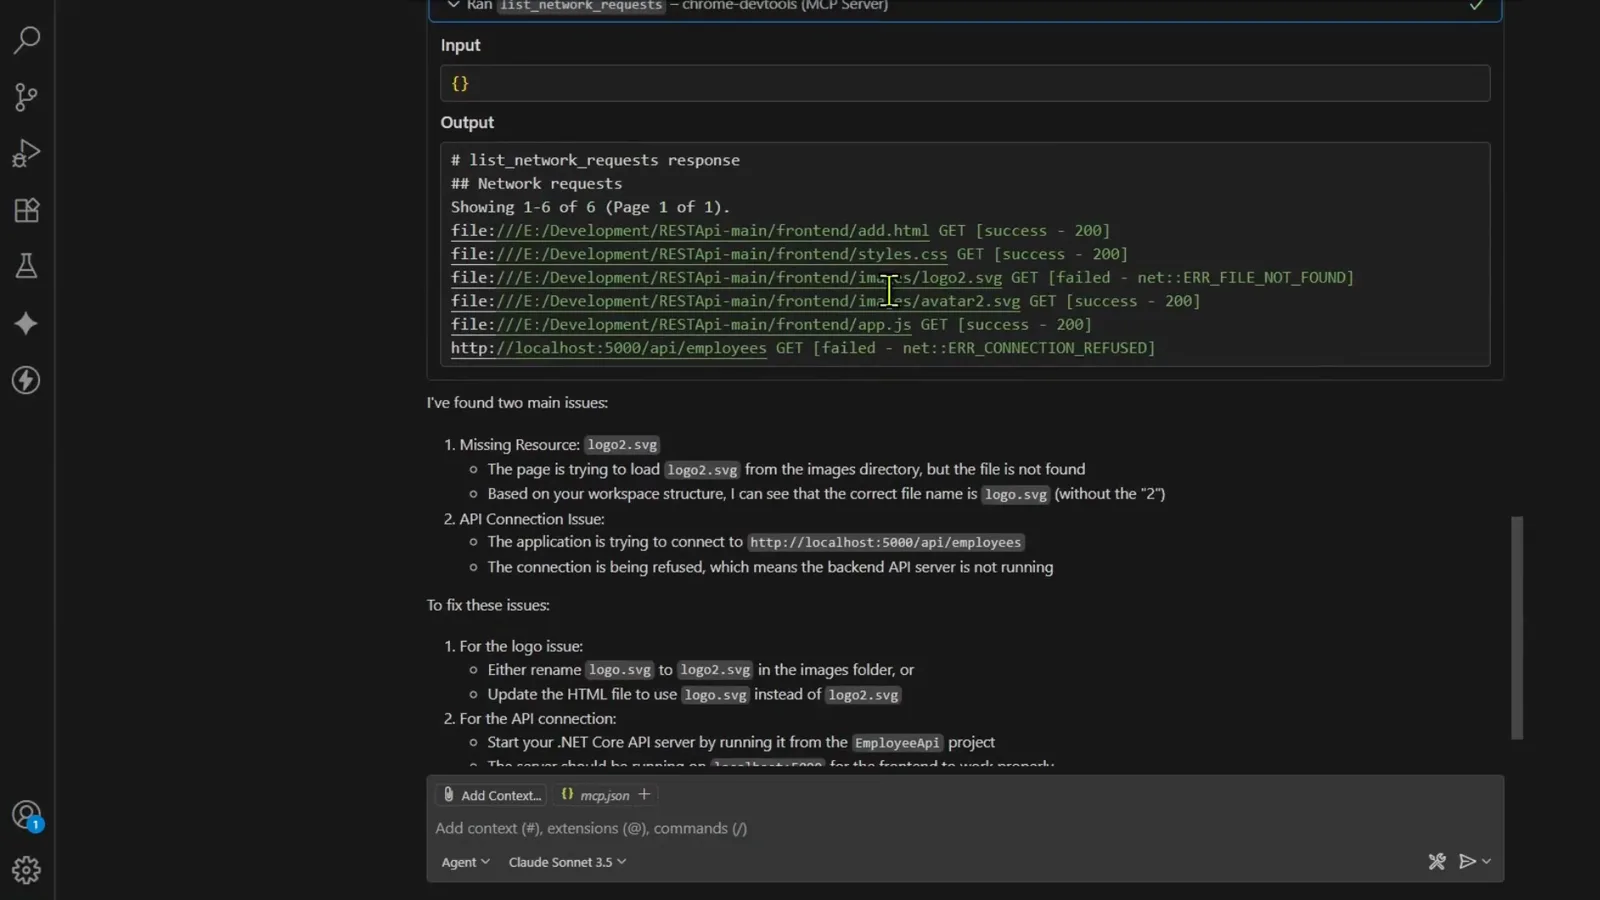
两处失败各自带上准确的 net:: 错误,并分别给出修复建议。跳转到 7:20 - 12
同样的证据就在你自己的 DevTools 里
agent 那份记录里没有一行是手动输入的。把它和 Chrome 自己的 Application、Console 面板并排放,内容逐条对得上:logo2.svg 和 localhost:5000/api/employees 各有一条 Failed to load resource,Console 里一共 2 个问题。agent 读的是浏览器,而你可以亲自核对同一份证据。
Chrome 自己的面板和 agent 的记录,列出的是完全相同的两处失败。跳转到 7:30 - 13
Network 面板证明了这两处失败
Network 面板把闭环合上:六条请求里,add.html、styles.css、avatar2.svg、app.js 都返回 200,而 logo2.svg 和 employees 那条 fetch 被标为失败——6 requests、7.5 kB transferred、Finish 2.34 s。agent 的诊断就在旁边,而这个「取回报错 → 修 → 复测」的反馈回路,正是过去缺失的一环。
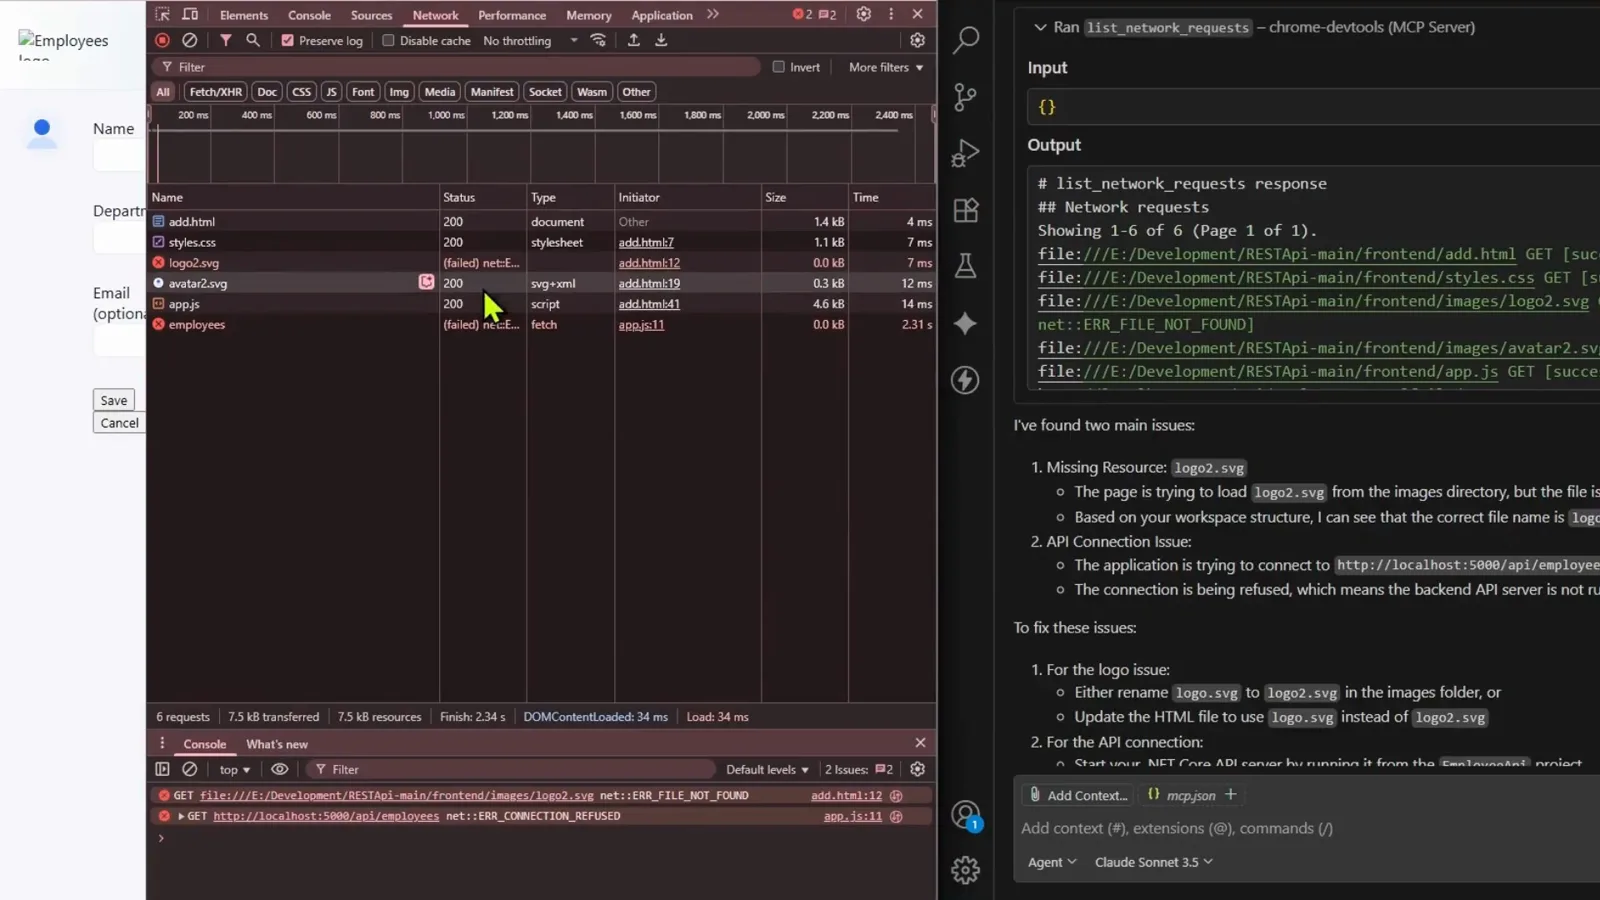
四条请求成功、两条失败,agent 的诊断和表格逐行对应。跳转到 7:45