
Illustrated walkthrough · 13 screenshots from one recording
Claude Code + Chrome DevTools MCP: Let the Agent See Your Browser
The Chrome DevTools MCP server hands a coding agent a real browser — console logs, DOM, network traffic and performance, read live instead of pasted by hand. This walkthrough follows the README install command, the 26 tools the server exposes, and a debugging session that finds a broken image and a dead API.
About 5 min · 13 steps, each linked to the exact second of the source video
TL;DR — what the Chrome DevTools MCP server changes
Without it, an agent debugging a web page is blind: you describe the symptom and paste the errors yourself. The Chrome DevTools MCP server closes that gap by exposing the live browser as tools. It installs from the README in one line for Claude Code — claude mcp add chrome-devtools npx chrome-devtools-mcp@latest — needs only Node.js v20.19 or newer, Chrome stable and npm, and reports 26 tools once started. The video then uses them the way they are meant to be used: one prompt asking for a root cause, a tool-approval click, and the agent opens the page, reads the console, dumps six network requests and names both failures with their exact net:: errors. You can verify every line in Chrome's own Console and Network tab, because it is the same evidence.
Source video
All screenshots come from a screen recording by StonerStack — a walkthrough that installs the Chrome DevTools MCP server and then debugs a local page with it.
Frames illustrate our own written instructions. The demo runs in VS Code with GitHub Copilot in agent mode (Claude Sonnet 3.5), not in Claude Code itself; the Claude Code line shown is the one printed in the server's README. A VS Code restart is needed before the tools appear, and the video shows no pricing, plan or token figures.
What the server unlocks
A connector that lets an assistant read the live browser instead of waiting for you to paste the errors.
- 1
Start from Google's own explainer
The developers.chrome.com post is the fastest orientation: it explains what the server is, why it matters, and what it can read. The Performance panel beside it is the payoff — Largest Contentful Paint at 0.98 s is good while Cumulative Layout Shift at 0.29 is poor, exactly the kind of reading an assistant can now take on its own. The blog's performance prompt is 'Localhost:8080 is loading slowly. Make it load faster.'
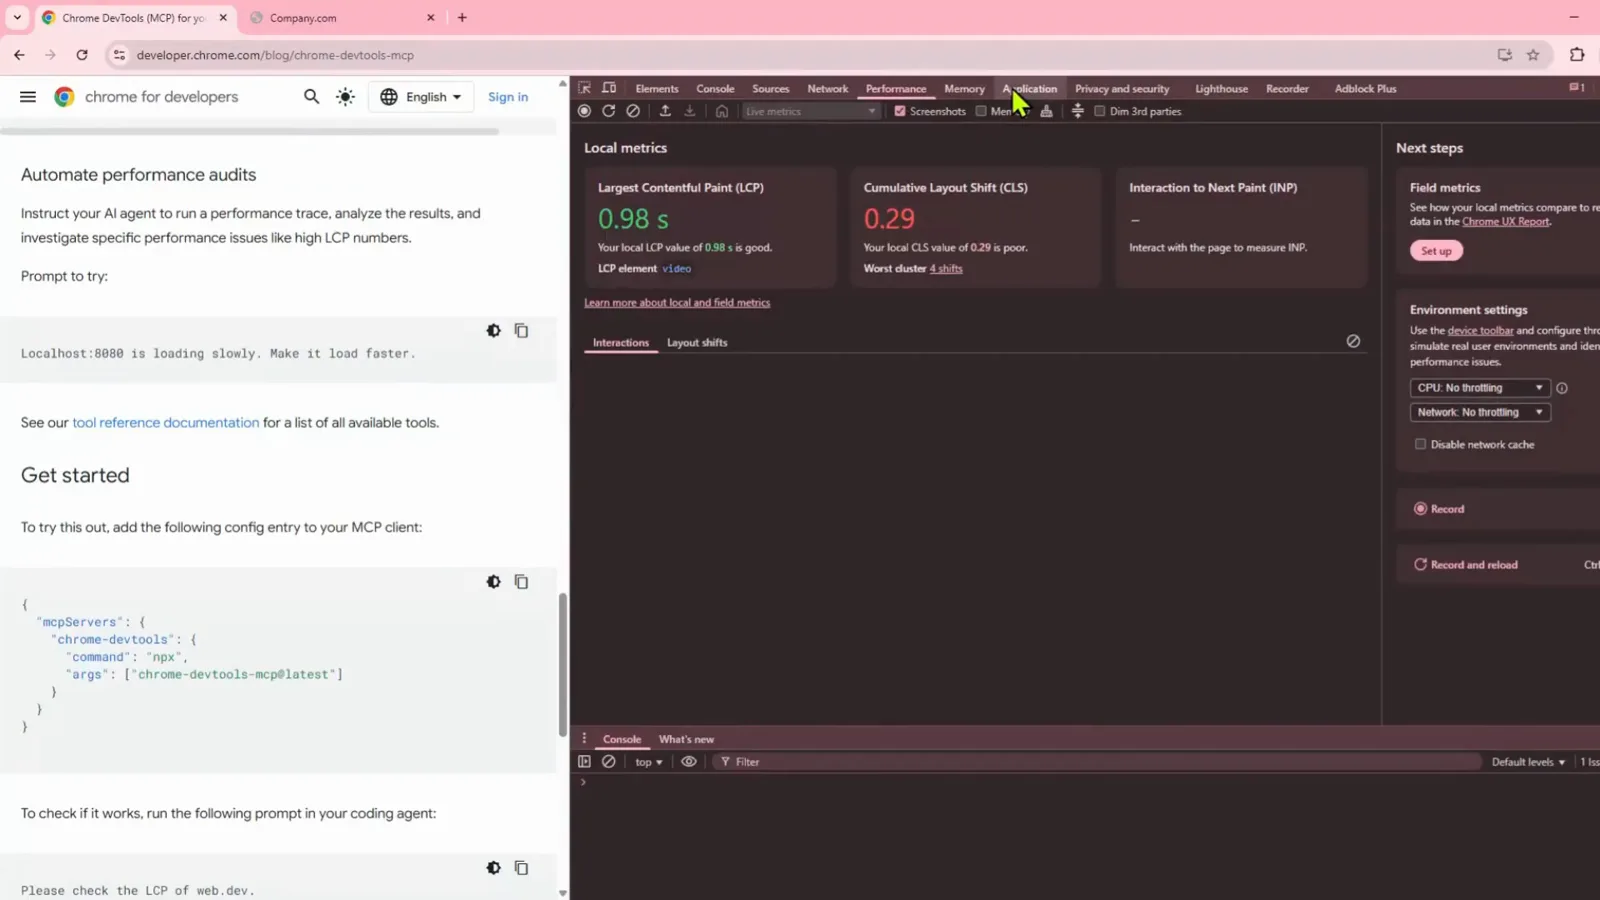
Google's blog explains the server; the Performance panel shows the kind of numbers it hands back.Watch at 1:20 - 2
Copy the config, run the smoke test
The same post publishes a ready-to-paste mcpServers block for your client's configuration file, plus a one-line smoke test — 'Please check the LCP of web.dev.' That is a good first check, because if the assistant can measure LCP on a real page, the browser connection is live.
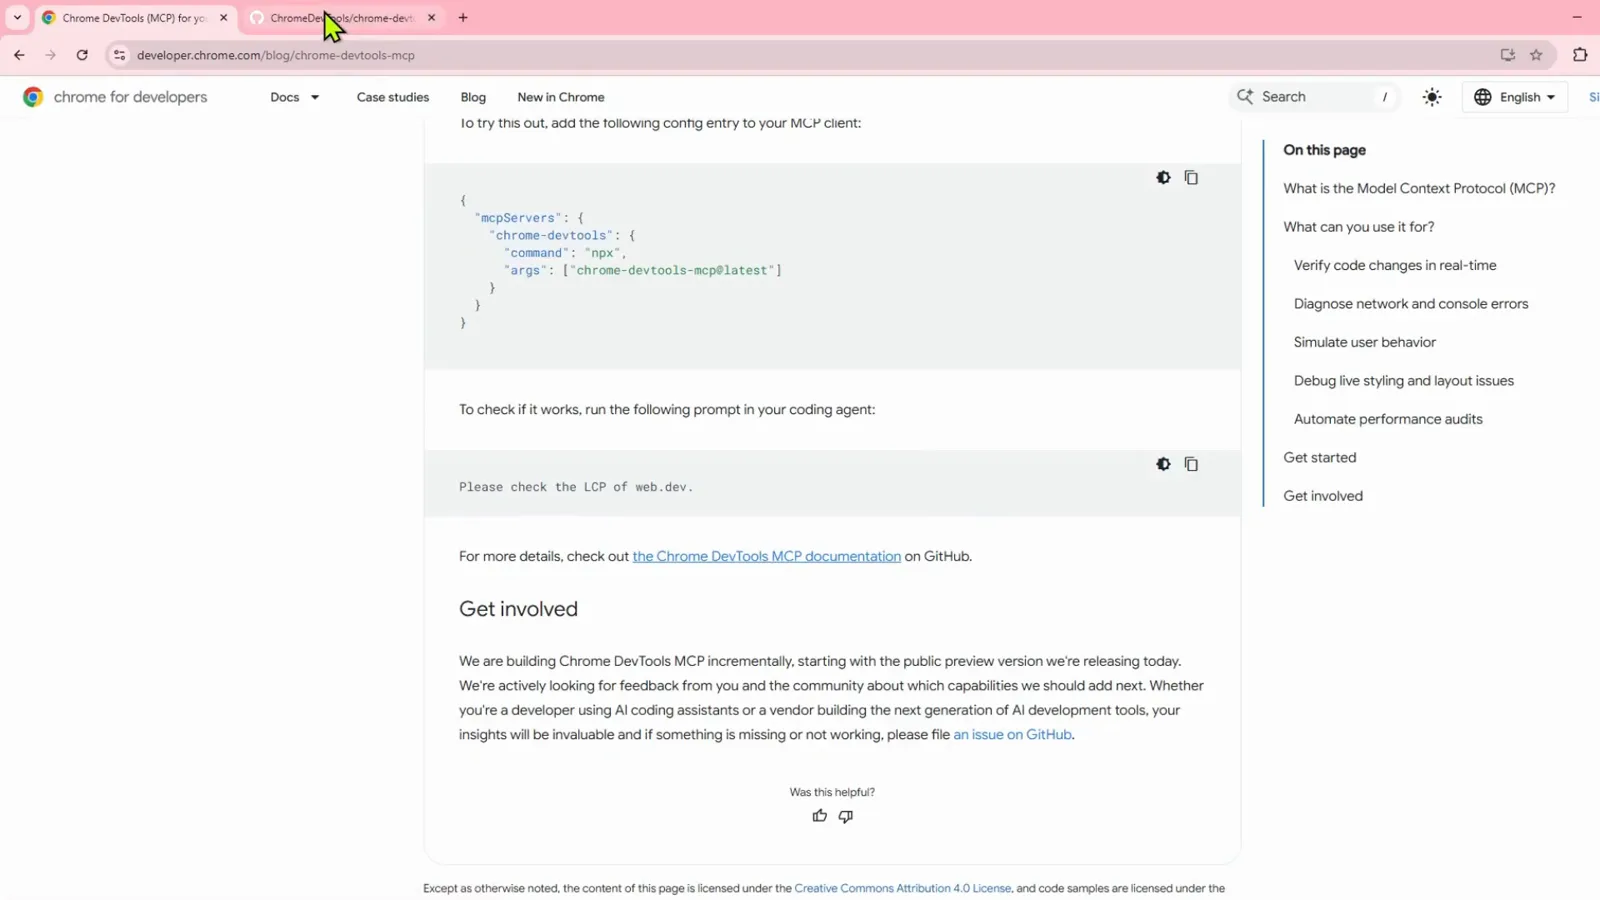
One config block to paste, one prompt to prove the connection works.Watch at 2:05 - 3
Check the three requirements
The README's Requirements section is short: Node.js v20.19 or a newer latest maintenance LTS version, the current stable version of Chrome, and npm. Nothing else needs installing — the server itself arrives through npx when the MCP client starts it.
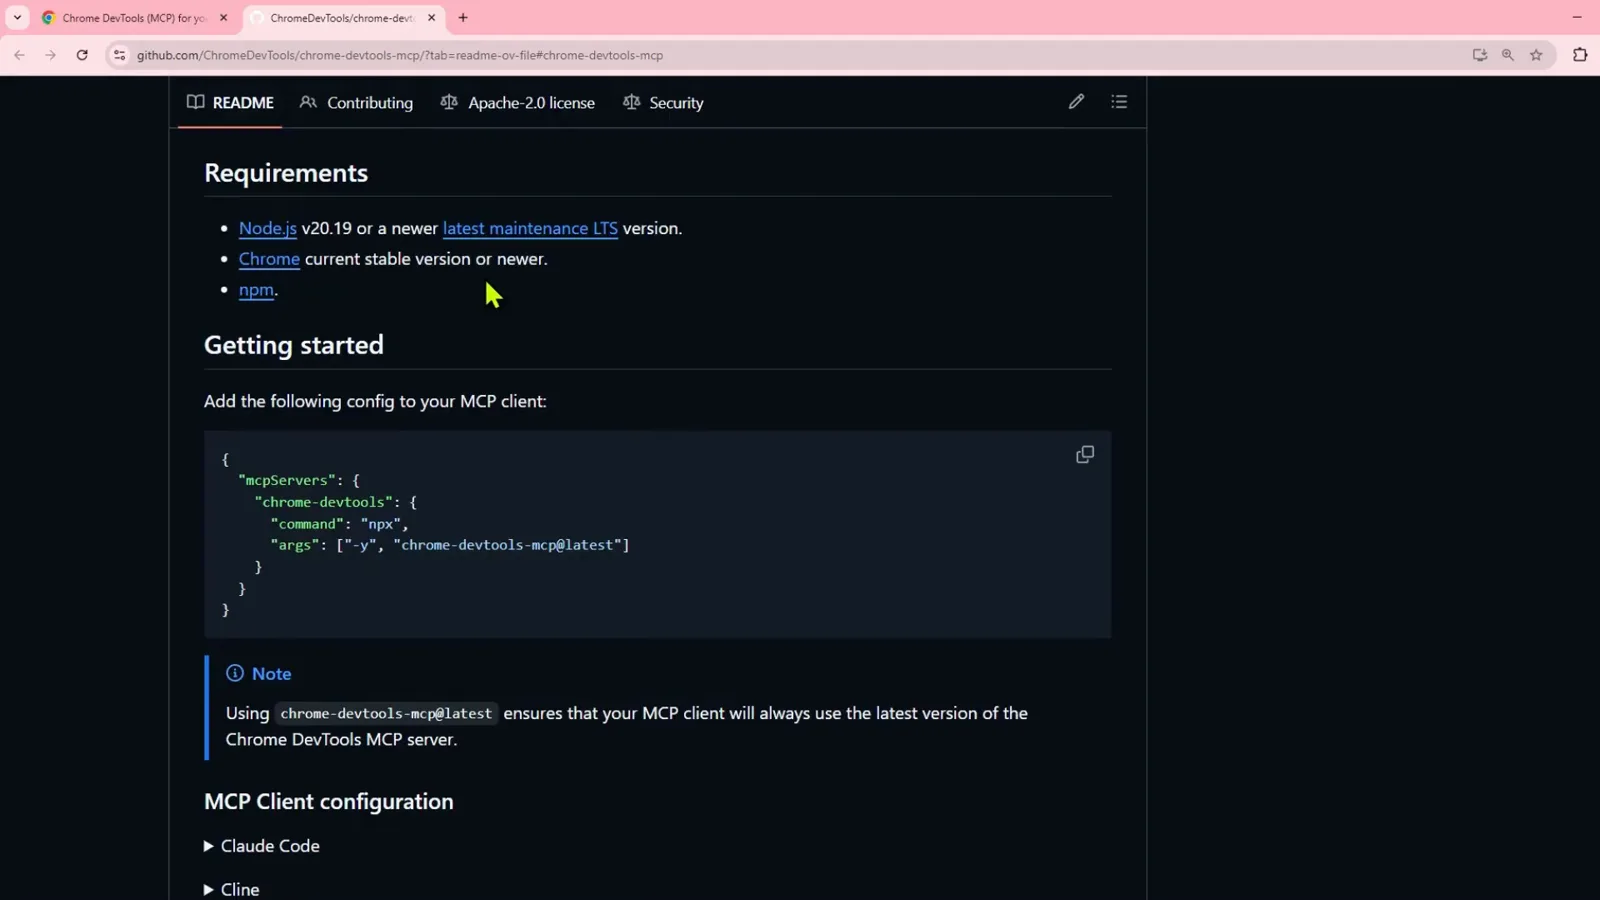
Node, Chrome and npm. The server runs through npx, so there is nothing else to install.Watch at 2:20
Install it for Claude Code
One README command, or the editor's own add-server path — then check the entry that starts the tools.
- 4
The Claude Code install line
The README's MCP Client configuration section carries a Claude Code entry with the exact command: claude mcp add chrome-devtools npx chrome-devtools-mcp@latest. Run it once and the server is registered for that scope — no hand-edited JSON required.
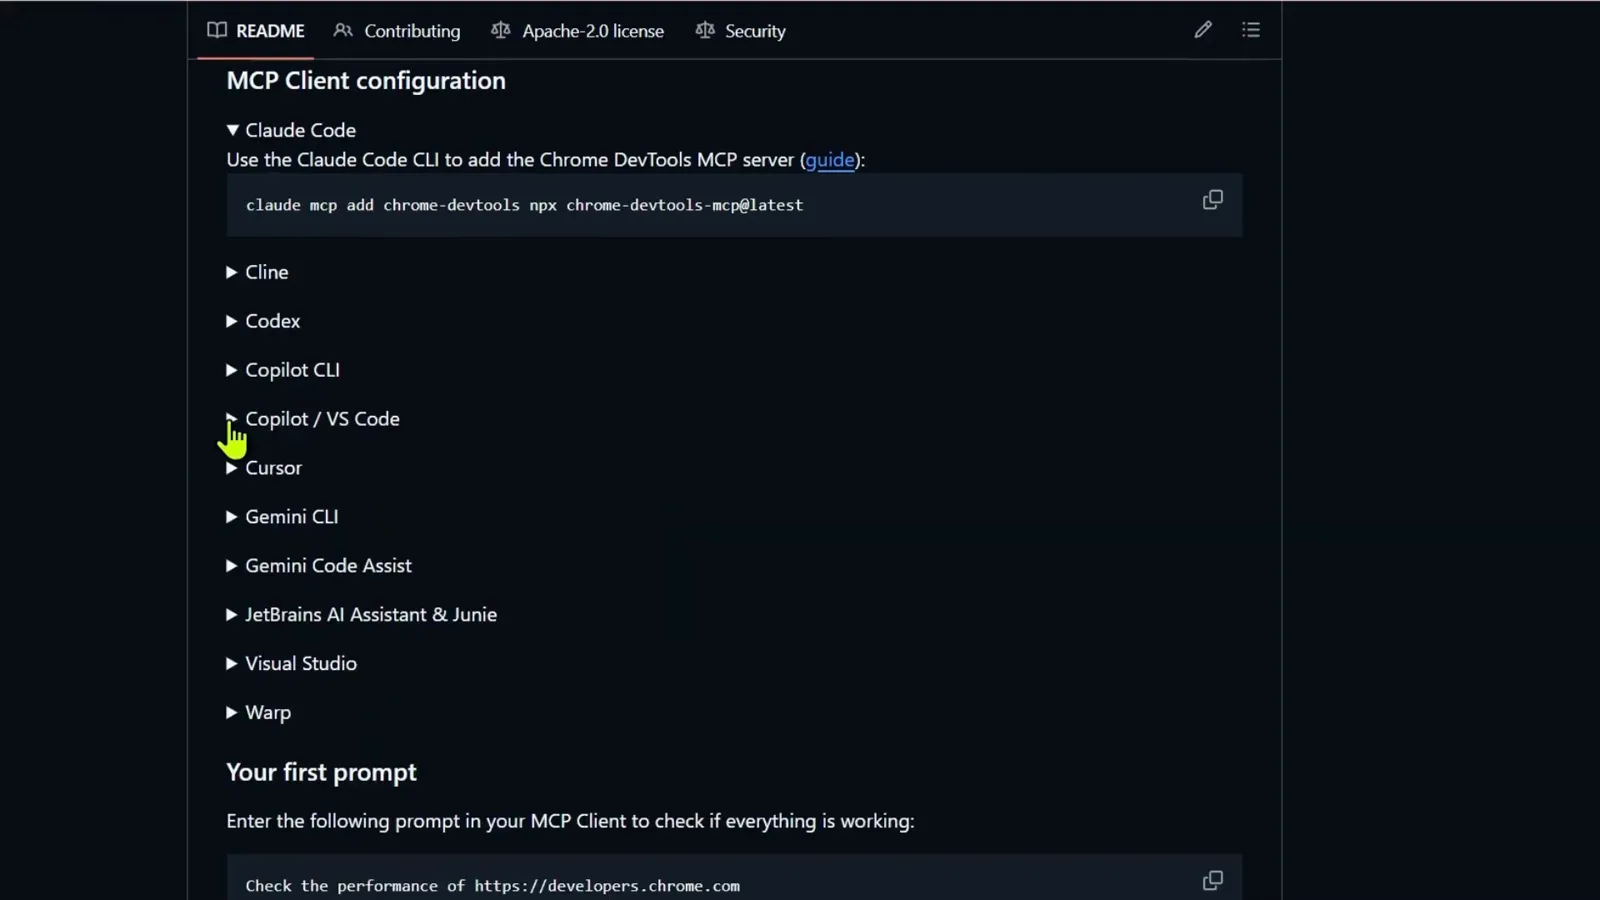
The README's Claude Code section, with its copyable mcp add command.Watch at 2:45 - 5
Or add it from the editor side
If you work inside VS Code rather than the Claude Code CLI, the VS Code MCP documentation lists several ways to register a server; the video recommends only two, the command line and the user configuration file. The command-line route is the code --add-mcp example, and it is fussy about quoting.
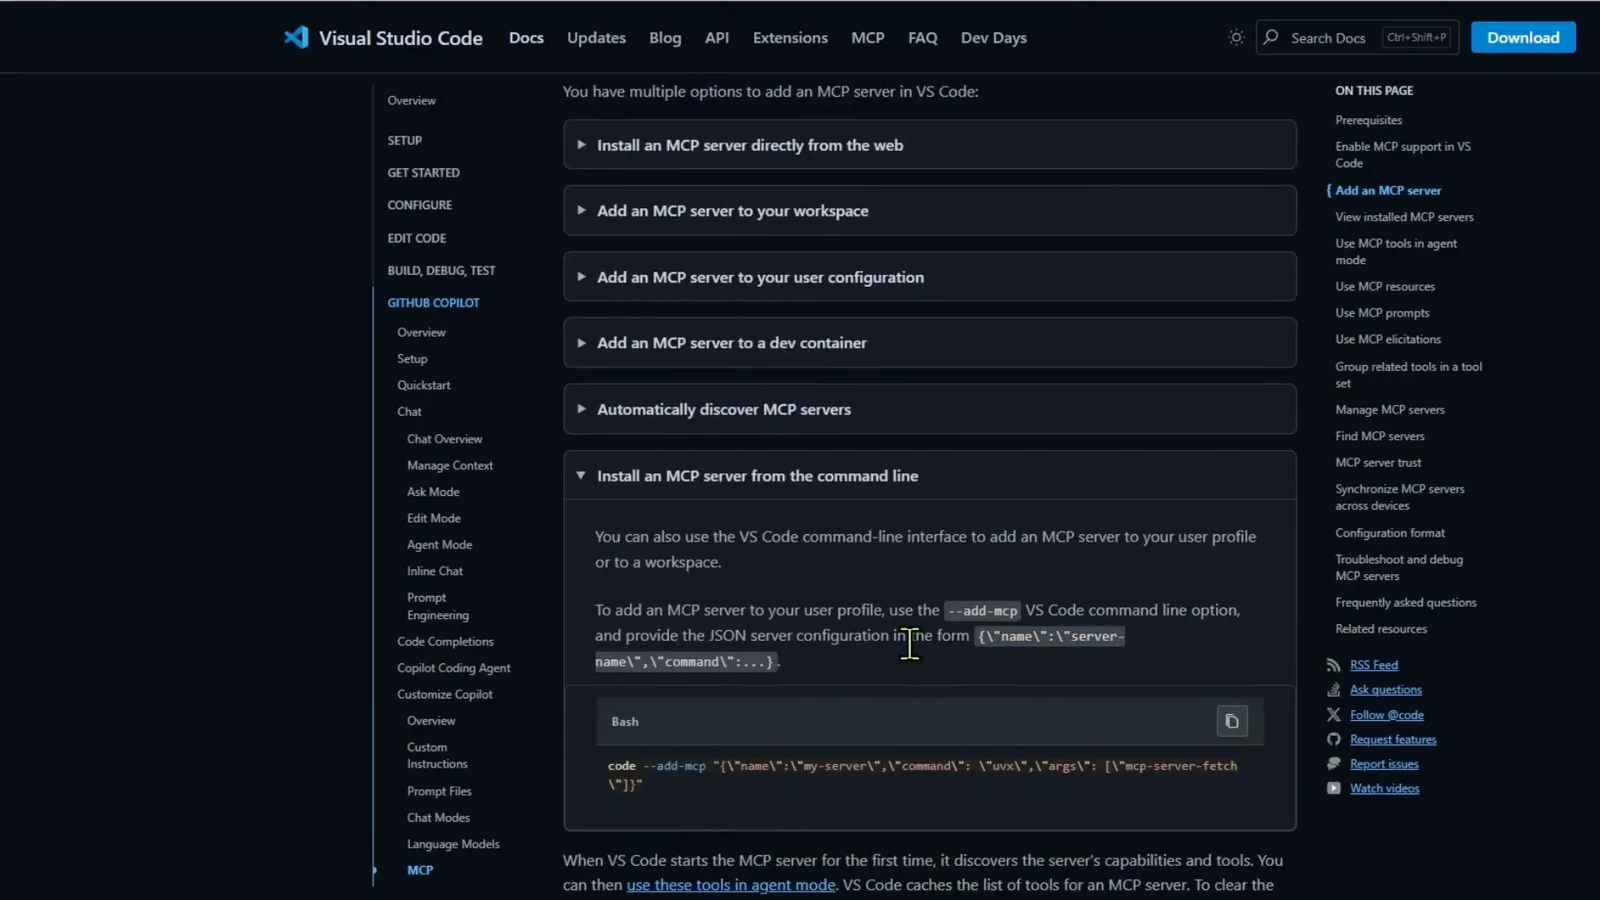
VS Code documents several install paths; the video recommends just the CLI and the user config file.Watch at 3:30 - 6
The entry that starts 26 tools
After a failed first attempt — the double quotes in the JSON had to be escaped — the terminal reports 'Added MCP servers: chrome-devtools', and the user mcp.json gains a chrome-devtools entry that runs npx with chrome-devtools-mcp@latest. Started, it is annotated 'Start | 26 tools'.
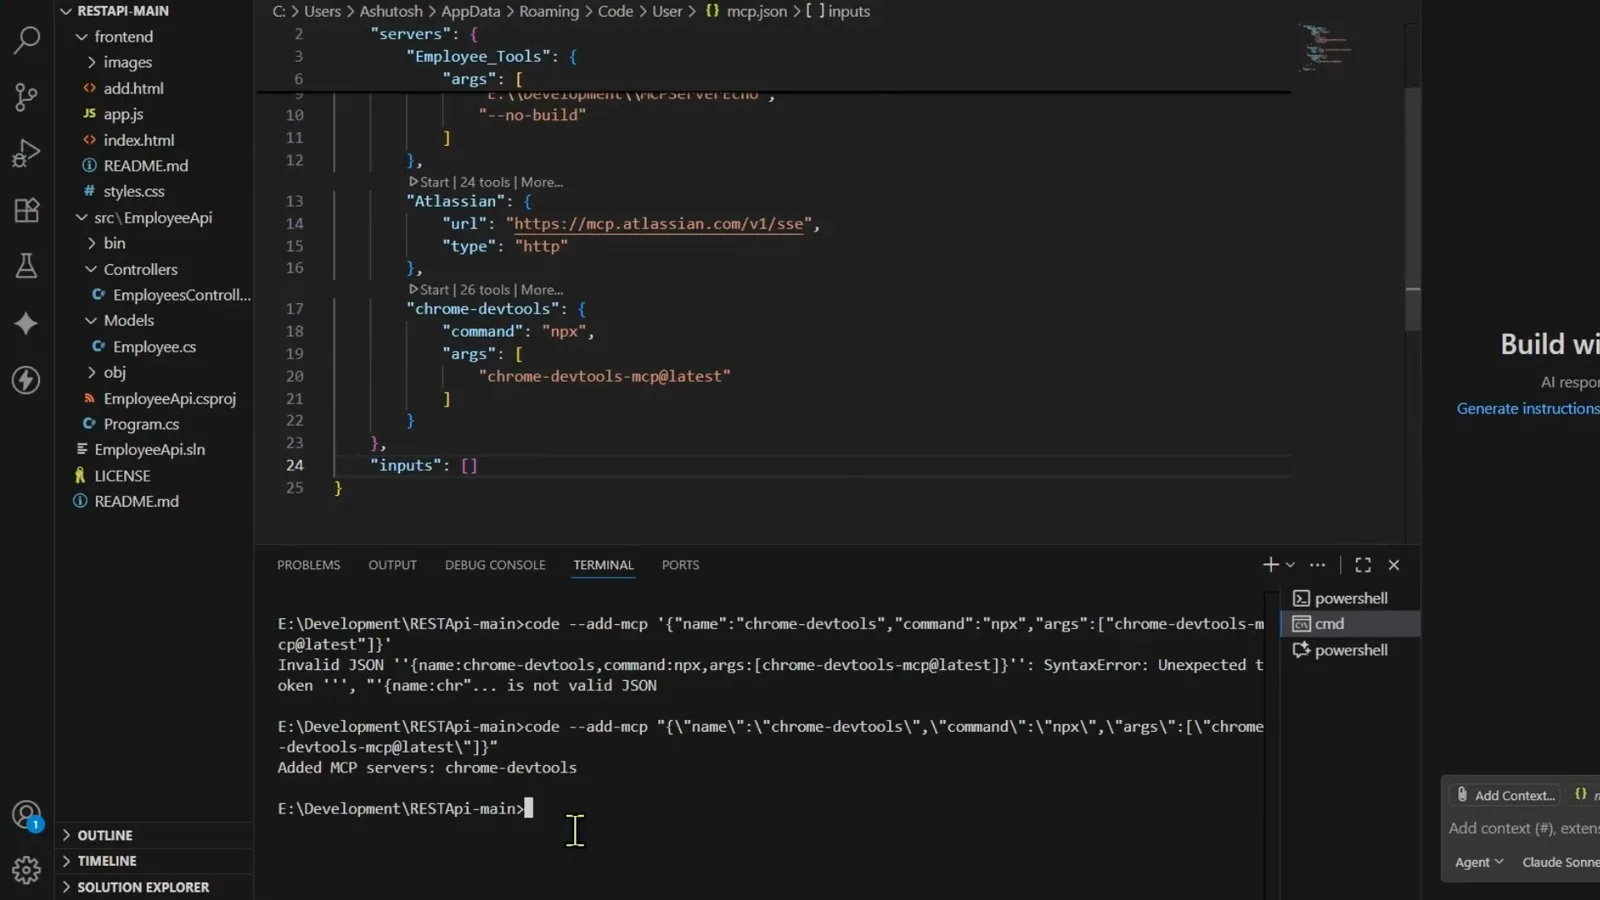
The successful add, the JSON it writes, and the 26 tools the server reports.Watch at 4:15
The tool surface
What those 26 tools actually cover, grouped the way the agent lists them.
- 7
Navigation and page management
Once VS Code has been restarted, the agent lists the server's tools by purpose. Navigation and Page Management covers navigate_page, navigate_page_history, new_page, list_pages, select_page, close_page and resize_page; Page Interaction covers click, fill, fill_form, hover, drag, upload_file, handle_dialog and wait_for. This is the half that lets an agent drive a real tab.
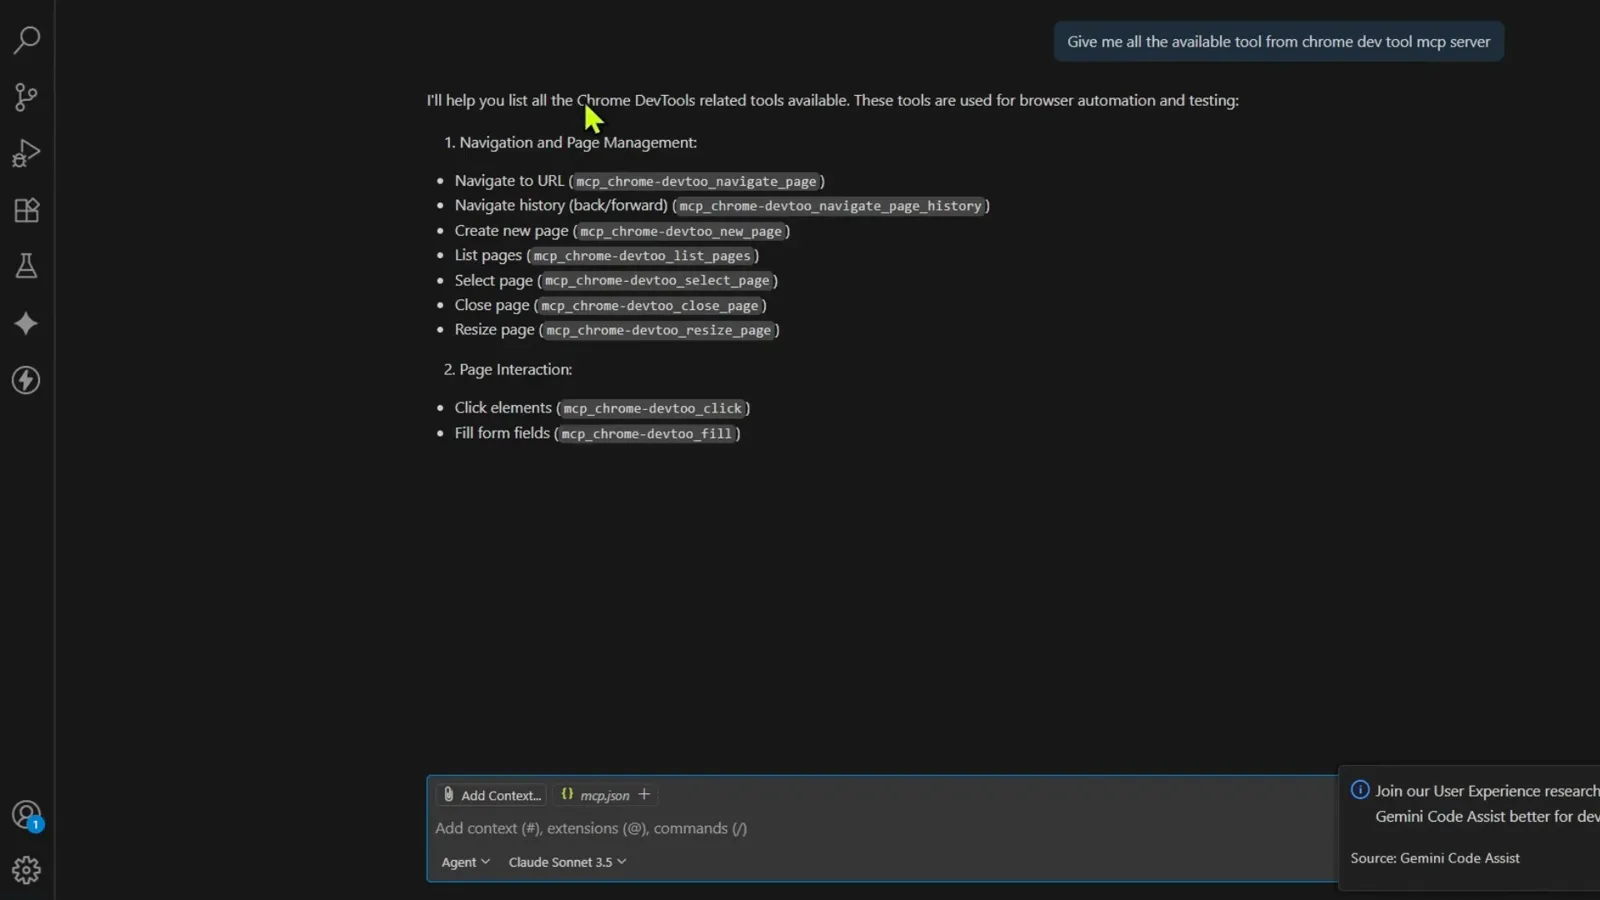
The agent groups the tools by purpose instead of dumping 26 flat rows.Watch at 5:20 - 8
Analysis, console and network
The second half of the inventory is the diagnostic half: Page Analysis with take_snapshot, take_screenshot, evaluate_script, list_console_messages and list_network_requests. Those last two are what turn 'here is my error message' into 'here is the evidence, fetched by the agent itself'.
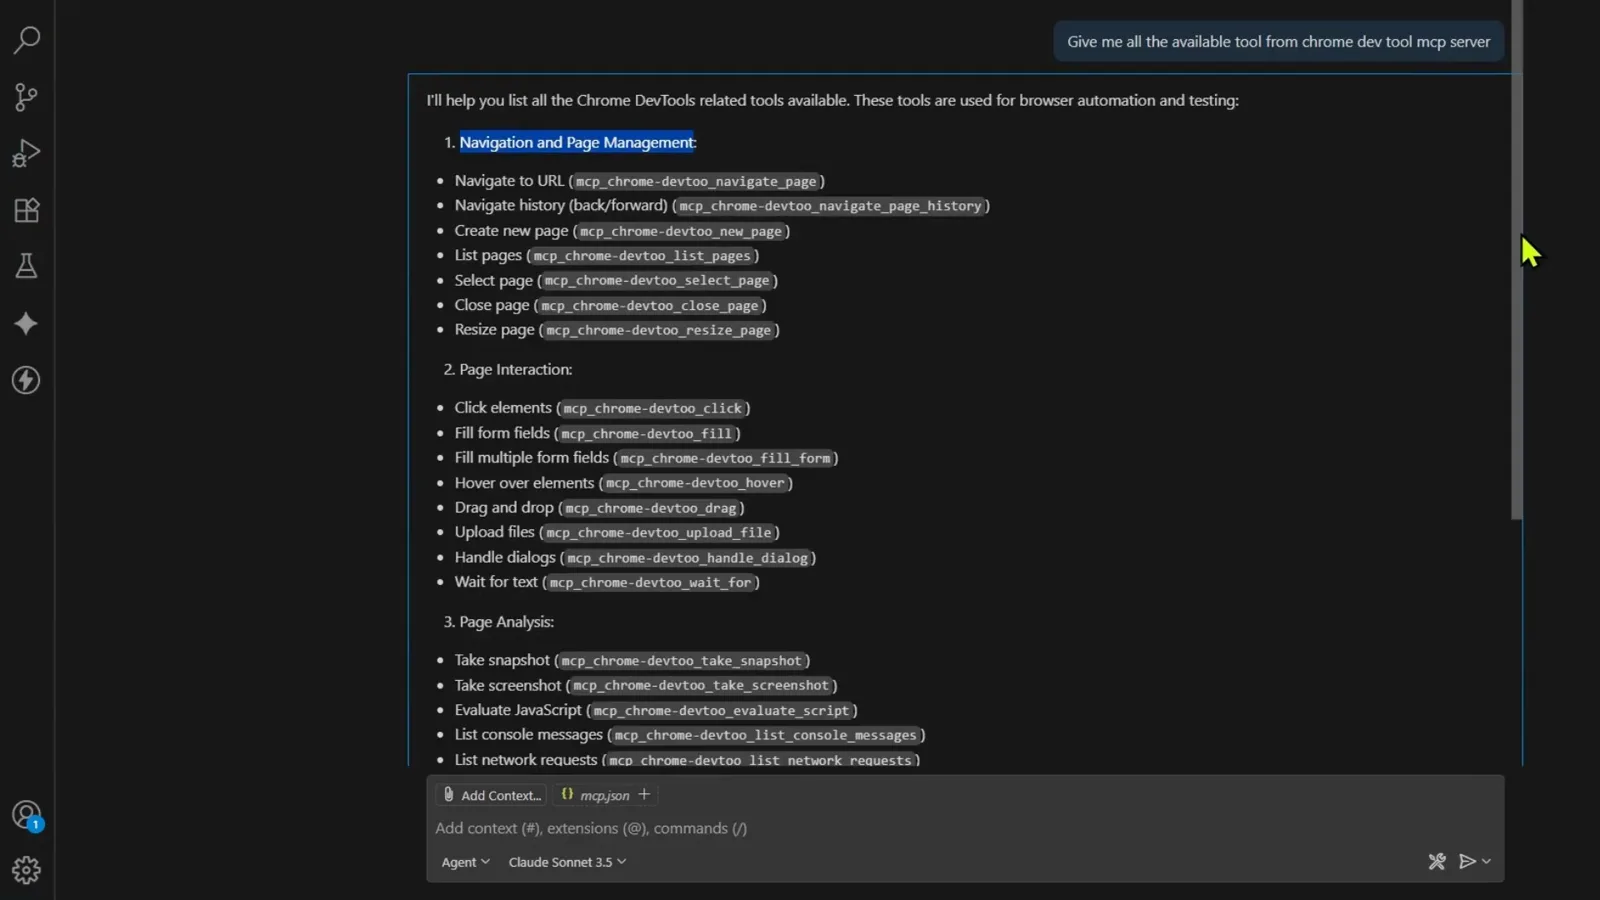
The diagnostic tools: snapshots, screenshot, script evaluation, console messages and network requests.Watch at 5:40
Debug a broken page with it
A local page with missing content, traced to two concrete failures without a single manual copy-paste.
- 9
Start from a page that is visibly wrong
The demo target is a local Add Employee page. The left rail shows a broken image icon and the Name, Department and Email fields sit empty — obviously wrong on screen, and exactly the situation where pasting console output into a chat used to be the only option.
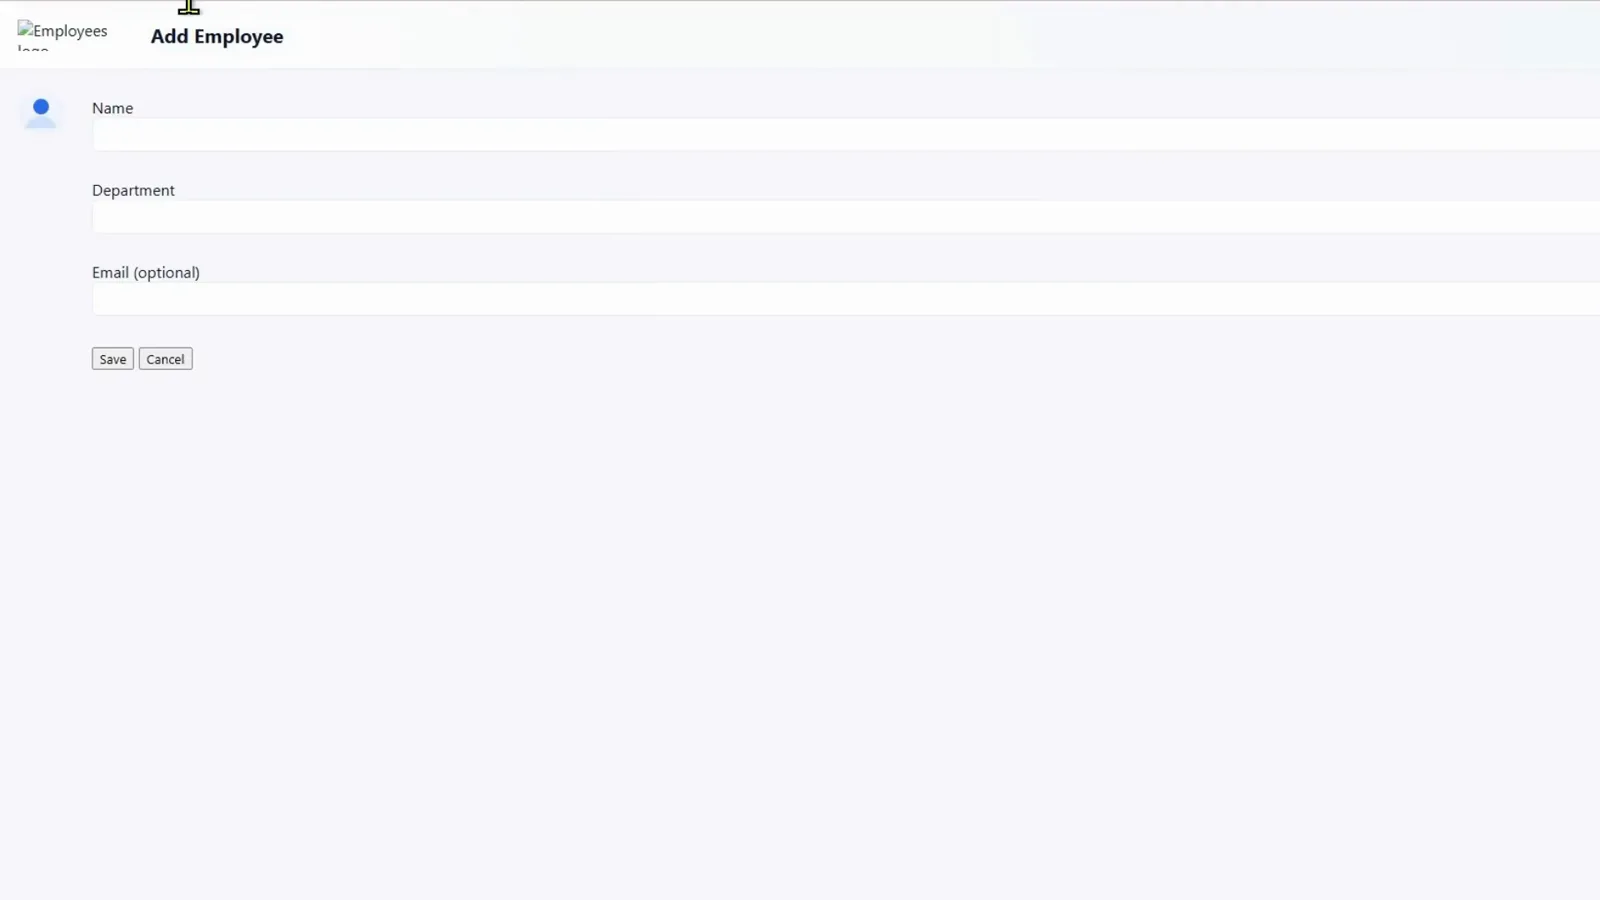
A page that is visibly broken: one missing image and a form with nothing in it.Watch at 6:10 - 10
Ask for the root cause, approve the tool
The prompt is deliberately open — the file path plus a request for the root cause — and the agent immediately asks permission to run the new_page tool against file:///E:/Development/RESTApi-main/frontend/add.html. Approving it opens a real Chrome, navigates there, then chains list_console_messages and list_network_requests on its own.
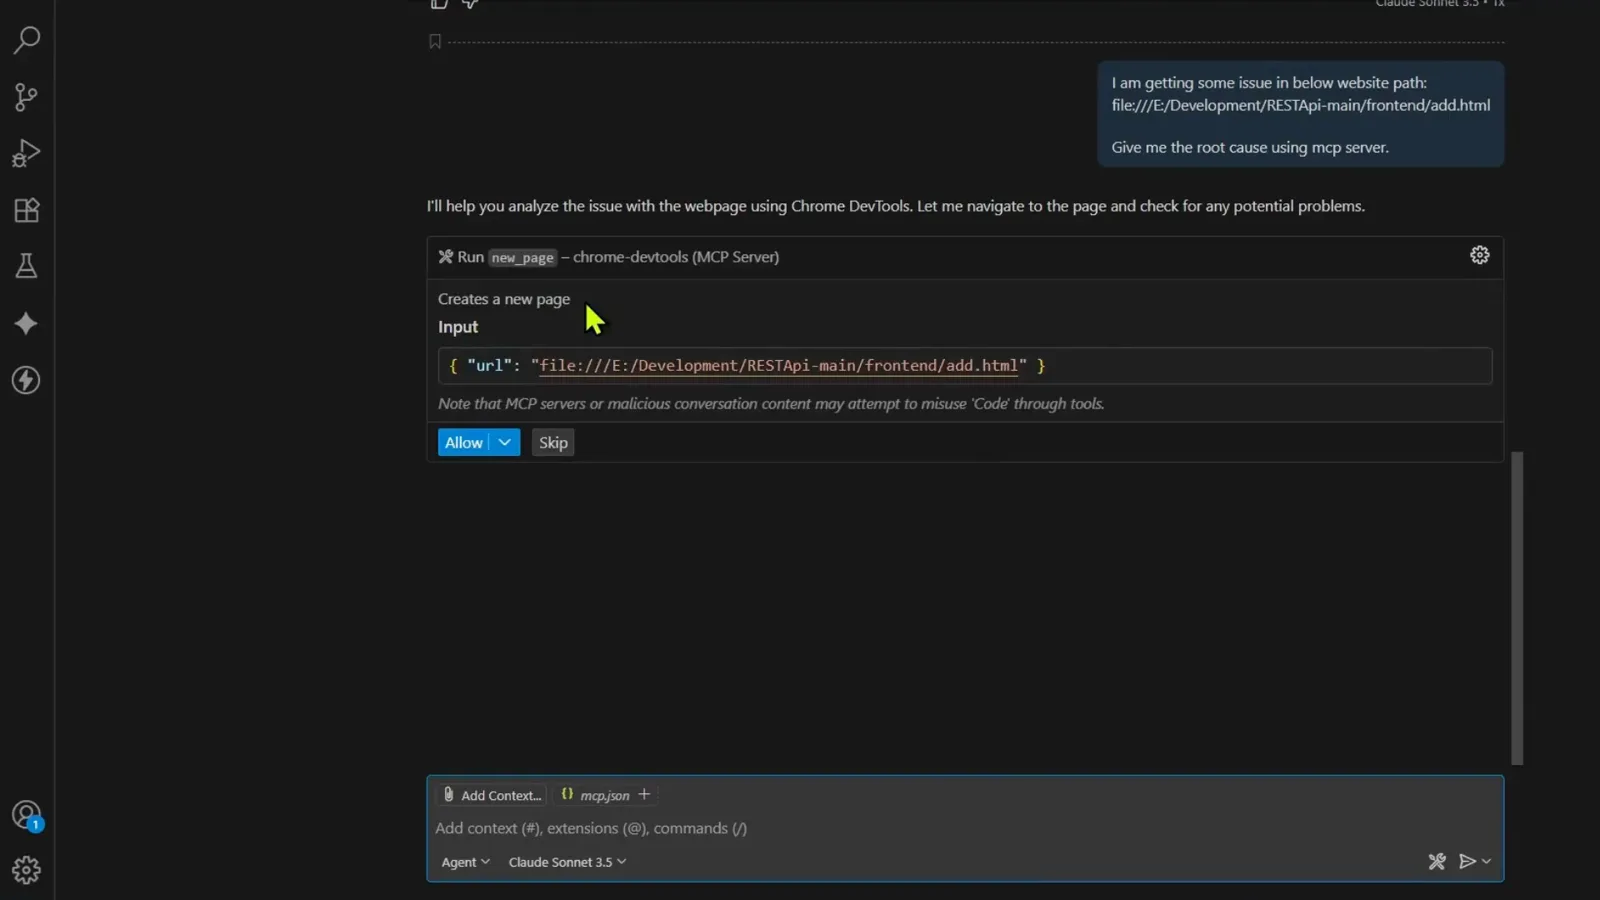
One approval card, then the agent opens the page and starts gathering evidence.Watch at 6:40 - 11
Six requests, two named failures
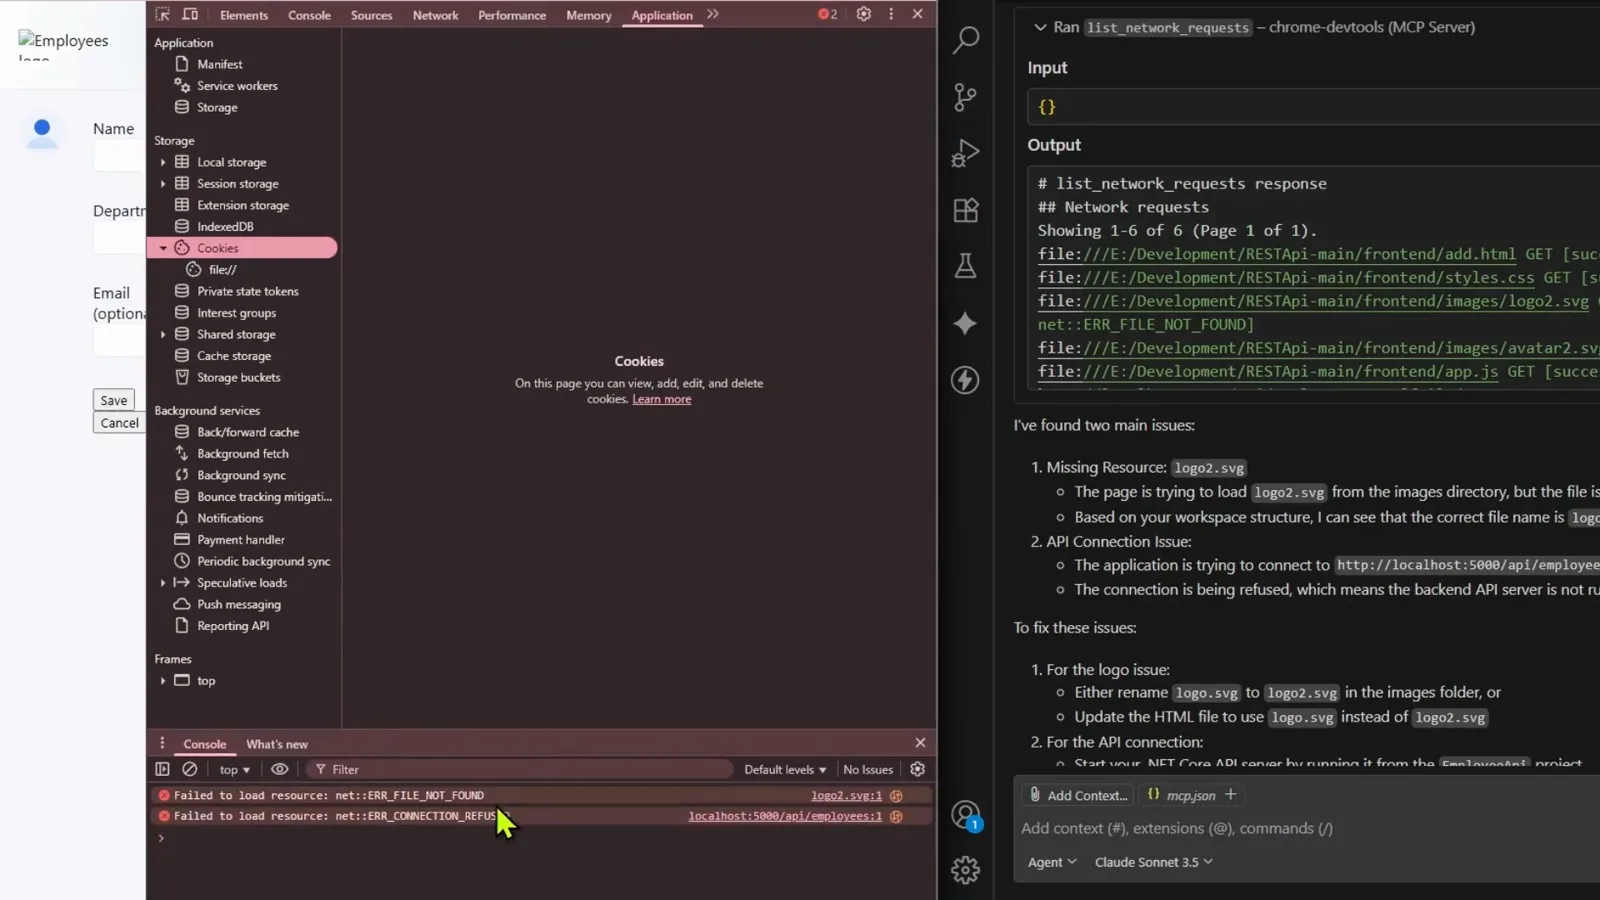
list_network_requests returns six requests for that page, and the agent reports two main issues: images/logo2.svg fails with net::ERR_FILE_NOT_FOUND, and http://localhost:5000/api/employees fails with net::ERR_CONNECTION_REFUSED. Its proposed fixes are concrete — rename logo.svg to logo2.svg or point the HTML at logo.svg, and start the .NET EmployeeApi project.
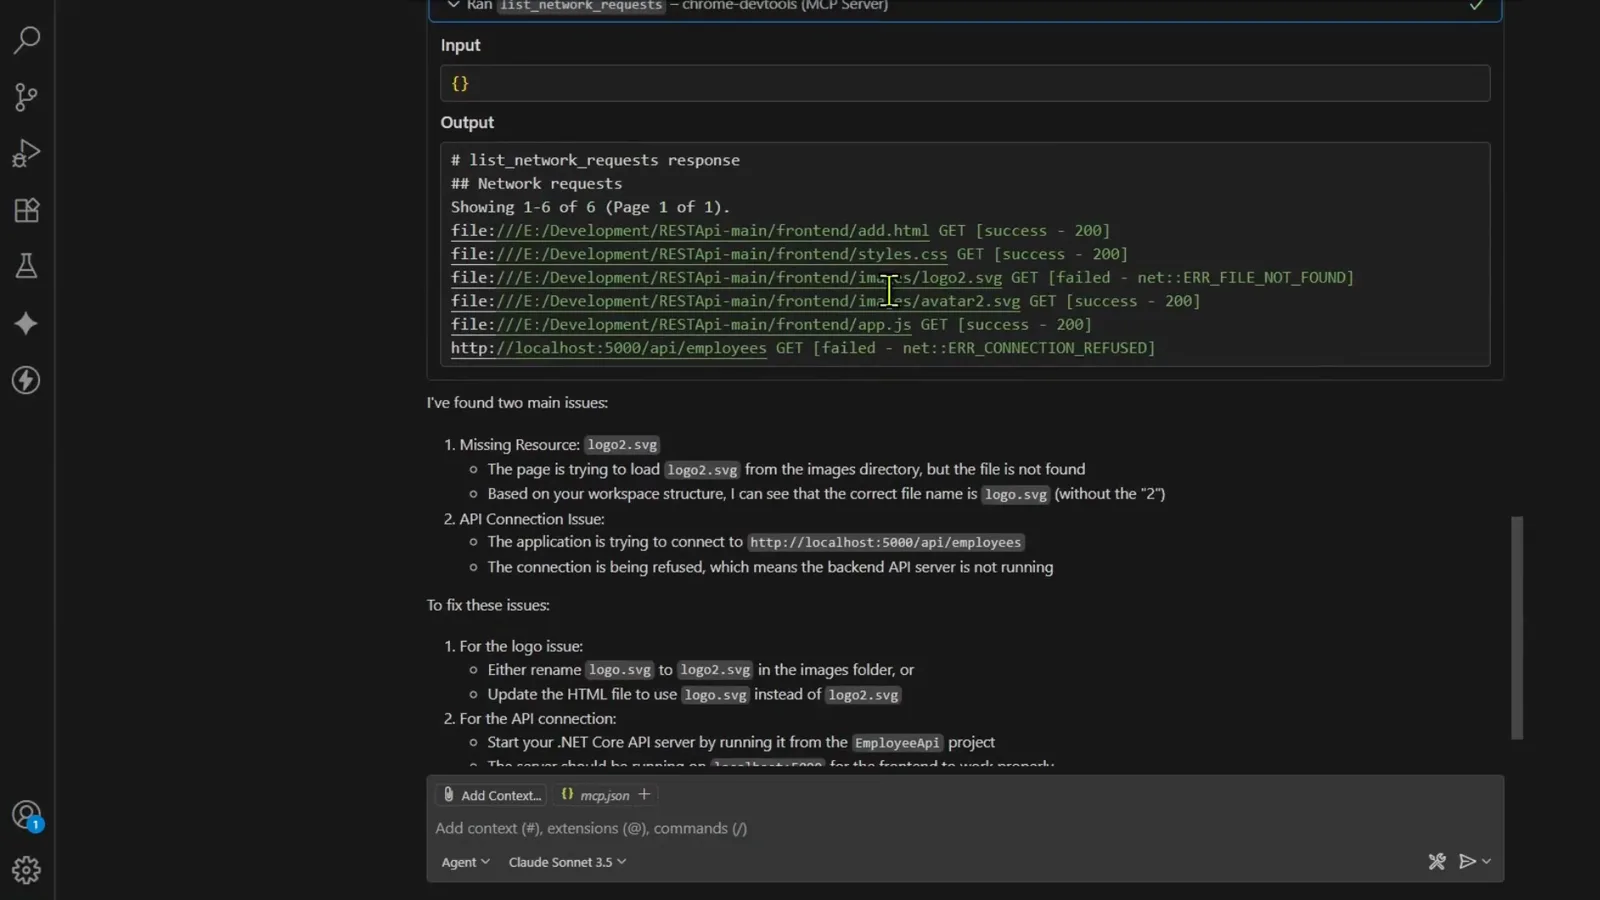
Two failures named with their exact net:: errors, and a fix offered for each.Watch at 7:20 - 12
The same evidence in your own DevTools
Nothing in the agent's dump was typed in by hand. Put Chrome's own Application and Console panels next to it and the lines match: Failed to load resource for logo2.svg and for localhost:5000/api/employees, two issues in the Console. The agent read the browser, and you can check the same evidence yourself.
Chrome's own panels and the agent's dump list the identical two failures.Watch at 7:30 - 13
The Network tab proves both failures
The Network tab closes the loop: six requests, with add.html, styles.css, avatar2.svg and app.js returning 200 while logo2.svg and the employees fetch are marked failed — 6 requests, 7.5 kB transferred, finish 2.34 s. The agent's diagnosis sits beside it, and that feedback loop — fetch the errors, fix, retest — is the part that was missing before.
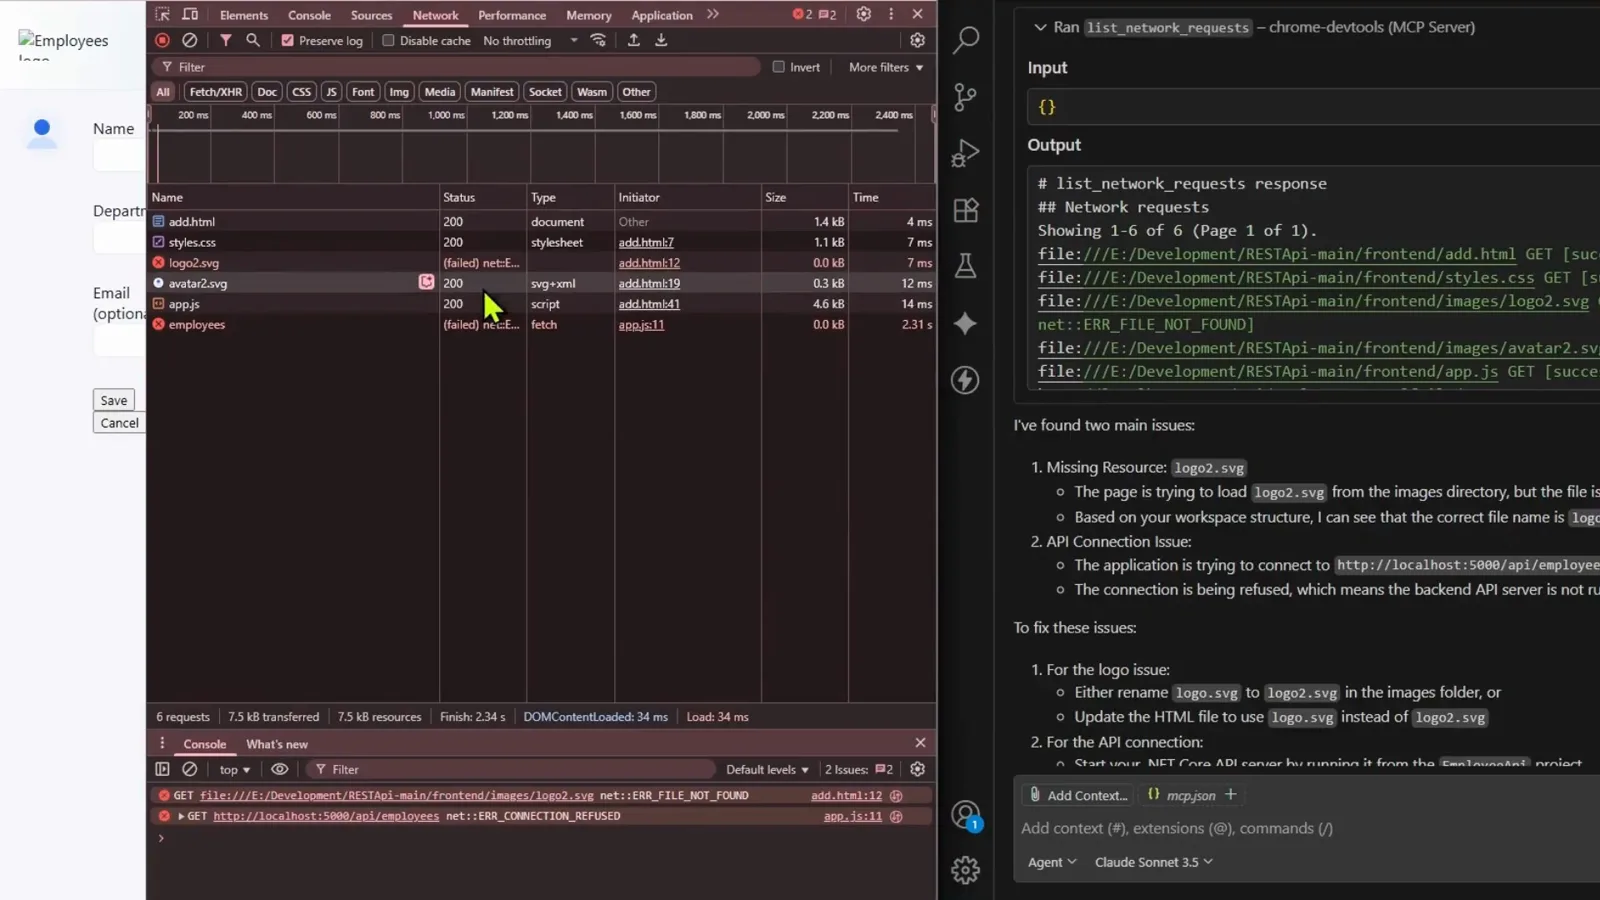
Four requests succeed, two fail, and the agent's diagnosis matches the table row for row.Watch at 7:45